Associations between DCV phenomena and crop productions in selected countries are shown here. The crop production data are from the Food and Agriculture Organization (FAO) of the United Nations. The crop production data are available from 1961 to 2016 and the processed food data (beer and wine) are available from 1961 to 2014. All production data are in metric tonnes.
Figures for ten countries (Australia, Brazil, Burkina Faso, China, Ethiopia, France, India, Nigeria, Syria, and U.S.A.) are shown either because they are major agricultural producers/consumers or because agriculture is at the subsistence farming level. Crop were selected for each country based on the importance of a crop for the country and/or for the world.
As an example of associations and the PDO index of up to four crops, the figure below shows changes in production between positive and negative PDO phases (as a percent of average production) in ten countries.

Choose a Country to display:
Australia is a major exporter of primary and derived agricultural products and thus plays a major role in the world food system. It is among the top ten producers of wheat, barley, grapes, sorghum, and derived products such as wine. The Pacific Decadal Oscillation (PDO) and Niño3.4 indices have substantial impacts on production of several crops.
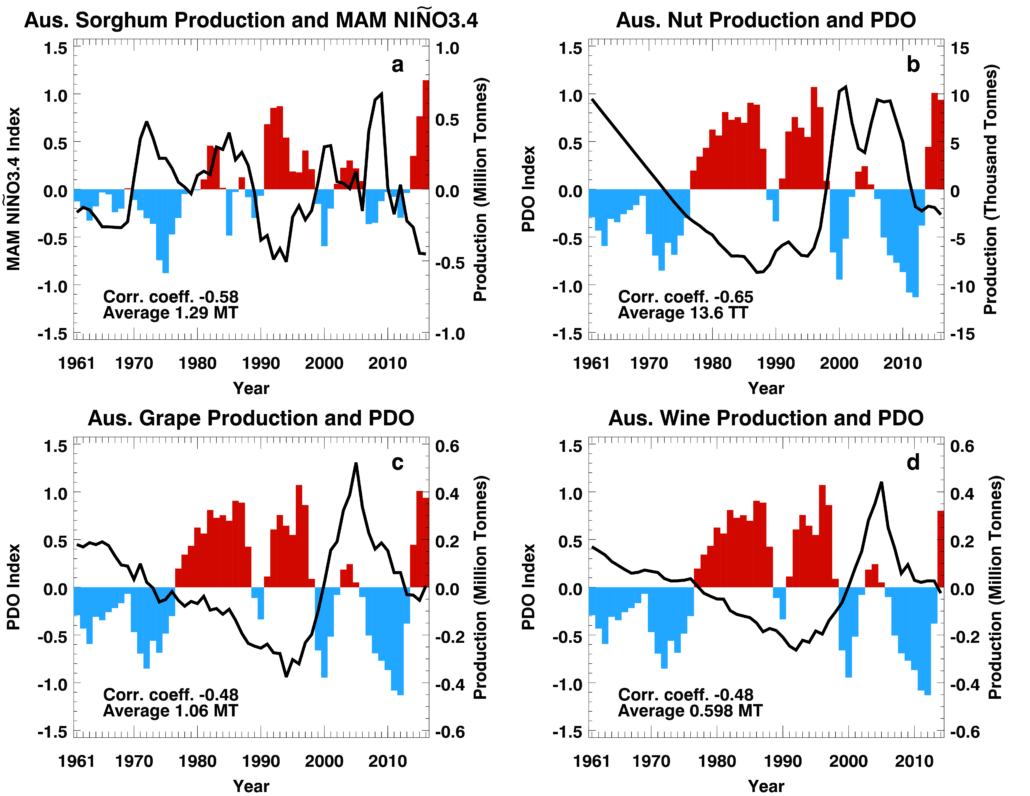 Time series of decadal climate variability indices (bars; left scale) and annual production (black line; right scale) in Australia during 1961 to 2016 (2014 for wine). Departures, smoothed by a 3-point moving-window filter, from average production are plotted. The average production and correlation coefficient between the two smoothed time series are shown; MT – million tonnes, TT – thousand tonnes. (a) Sorghum and MAM Niño3.4, (b) tree nuts and annual PDO, (c) grape and annual PDO, and (d) wine and annual PDO.
Brazil is the world’s largest producer of soybeans (with close to 30-35% of all production), the sixth largest producer of cocoa beans, the largest producer of oranges in the world, and largest producer of sugarcane. Brazil is also the largest exporter of ethanol made from sugarcane. The Pacific Decadal Oscillation (PDO) index has the strongest association with crop production in Brazil.
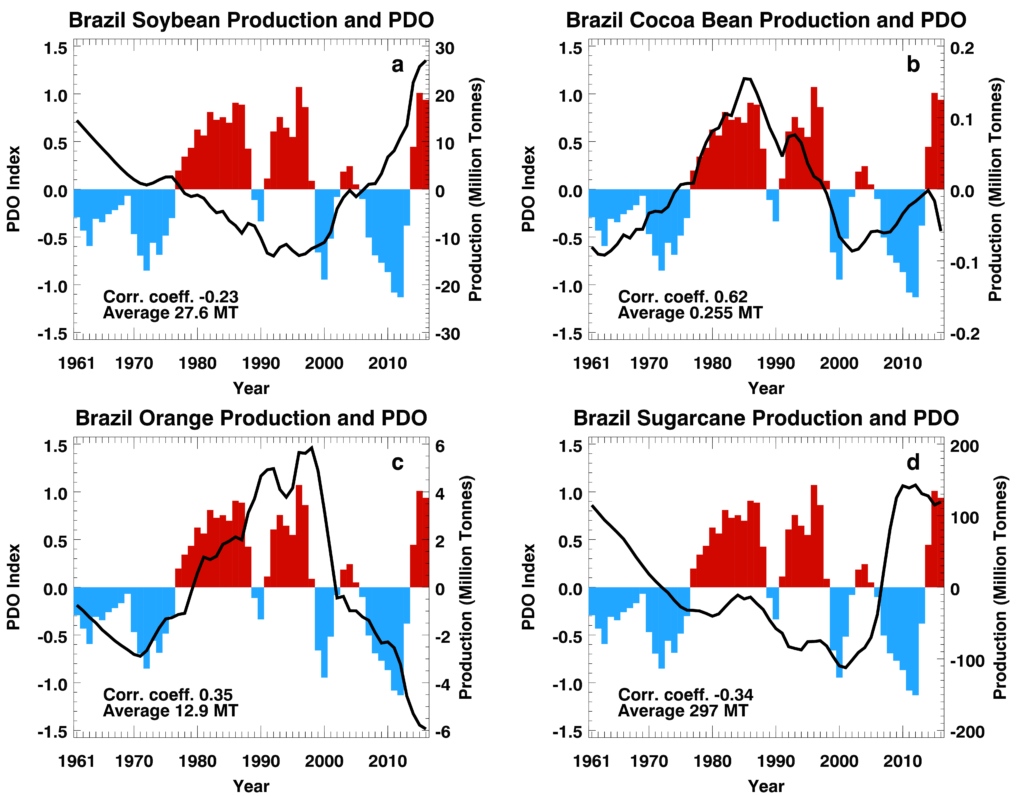 Time series of annual Pacific Decadal Oscillation index (bars; left scale) and annual production (black line; right scale) in Brazil during 1961 to 2016. Departures, smoothed by a 3-point moving-window filter, from average production are plotted. The average production and correlation coefficient between the two smoothed time series are shown; MT – million tonnes. (a) Soybean, (b) cocoa bean, (c) orange, and (d) sugarcane.
In Burkina Faso agriculture is almost entirely rain-fed and, therefore, highly vulnerable to climate variability. Almost 80% of the population is employed in agriculture, which is the mainstay of the country’s economy. Some of the main crops produced in Burkina Faso are corn (maize), rice, and groundnuts (peanuts), and their annual productions have substantial correlations with the Pacific Decadal Oscillation (PDO) index.
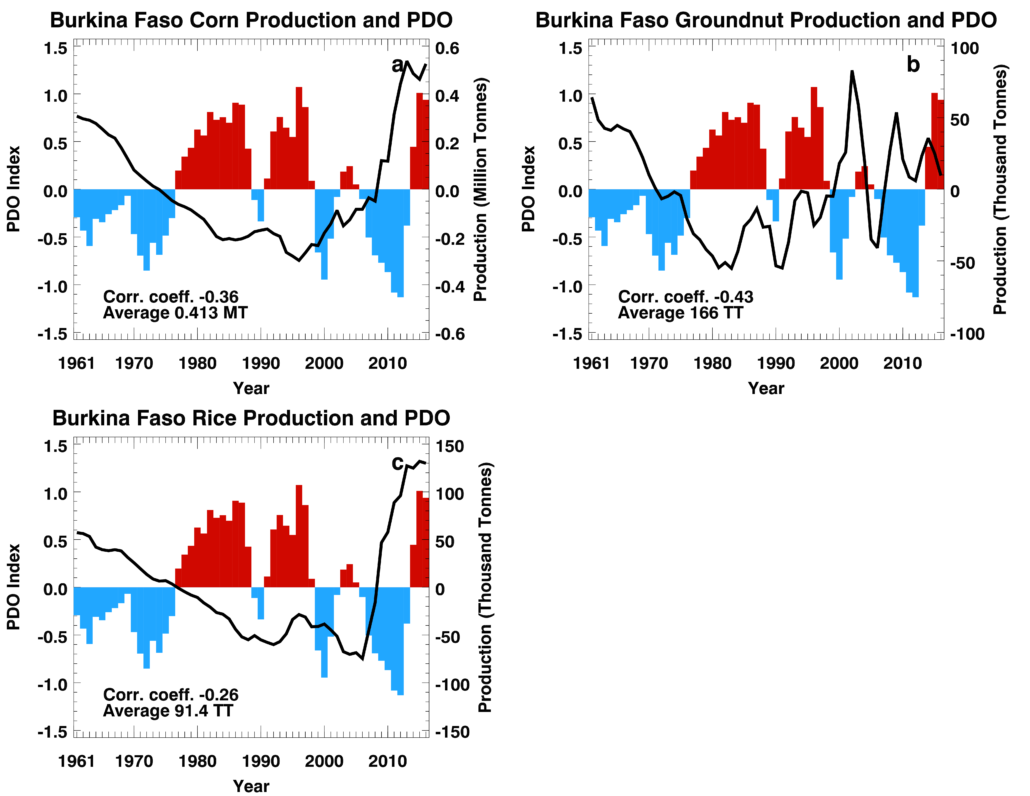 Time series of annual Pacific Decadal Oscillation index (bars; left scale) and annual production (black line; right scale) in Burkina Faso during 1961 to 2016. Departures, smoothed by a 3-point moving-window filter, from average production are plotted. The average production and correlation coefficient between the two smoothed time series are shown; MT – million tonnes, TT – thousand tonnes. (a) Corn, (b) groundnut, and (c) rice.
China produces the largest amount of agricultural output in the world on 10% of the world’s arable land. Agriculture is of vital importance to the country and employs close to 300 million farmers, 37% of its total workforce. Approximately 37% of the arable land is irrigated, leaving the remaining land to support rain-fed agriculture. Rice is China’s most important crop and consists of approximately 25% of the world’s rice crop. Wheat is the second most-prevalent crop, with China being the world’s top producer. The Pacific Decadal Oscillation (PDO) index has a substantial correlation with production of both crops.
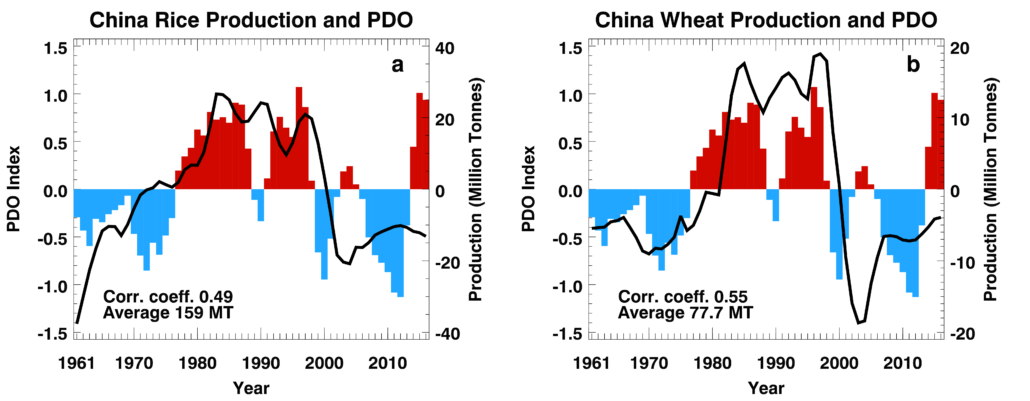 Time series of annual Pacific Decadal Oscillation index (bars; left scale) and annual production (black line; right scale) in China during 1961 to 2016. Departures, smoothed by a 3-point moving-window filter, from average production are plotted. The average production and correlation coefficient between the two smoothed time series are shown; MT – million tonnes. (a) Rice, and (b) wheat.
Agriculture contributes approximately 43% to Ethiopia’s economy and 90% to the country’s exports. Up to 80% of the labor force is engaged in the agriculture sector. Ethiopia is the world’s 5th largest chick pea producer, the 5th largest maize producer in Africa, produces wheat from the same regions as maize, and lentils are a staple food that is a major source of protein for the Ethiopian people. Variations in productions of all four crops are associated with the Pacific Decadal Oscillation (PDO) index.
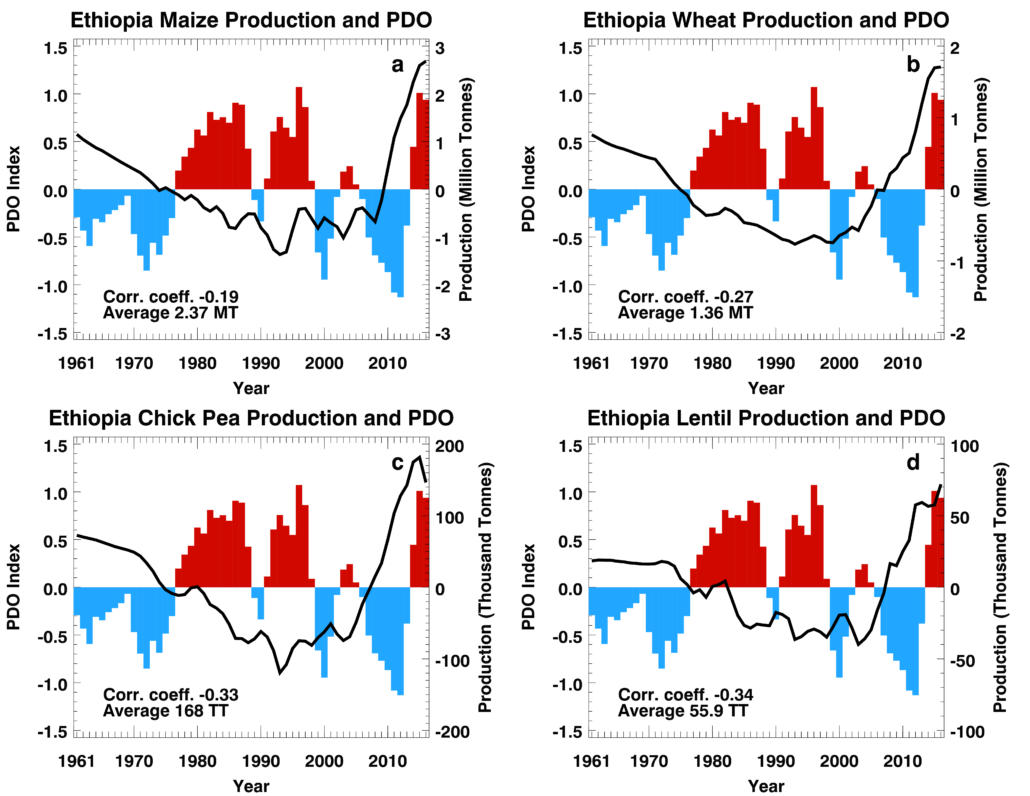 Time series of annual Pacific Decadal Oscillation index (bars; left scale) and annual production (black line; right scale) in Ethiopia during 1961 to 2016. Departures, smoothed by a 3-point moving-window filter, from average production are plotted. The average production and correlation coefficient between the two smoothed time series are shown; MT – million tonnes, TT – thousand tonnes. (a) Maize, (b) wheat, (c) chick pea, and (d) lentil.
France is the world’s sixth largest and Europe’s largest agricultural production country. France is the largest producer of sugar beet which is used mainly to produce sugar, is among the top ten maize (corn) producers in the world, is among the top five producers of mushrooms and truffles, and rye is an important crop cultivated mainly in the cooler climate of northern France. Crop productions in France have substantial associations with both the Pacific Decadal Oscillation (PDO) index and the tropical Atlantic sea-surface temperature graident (TAG) variability.
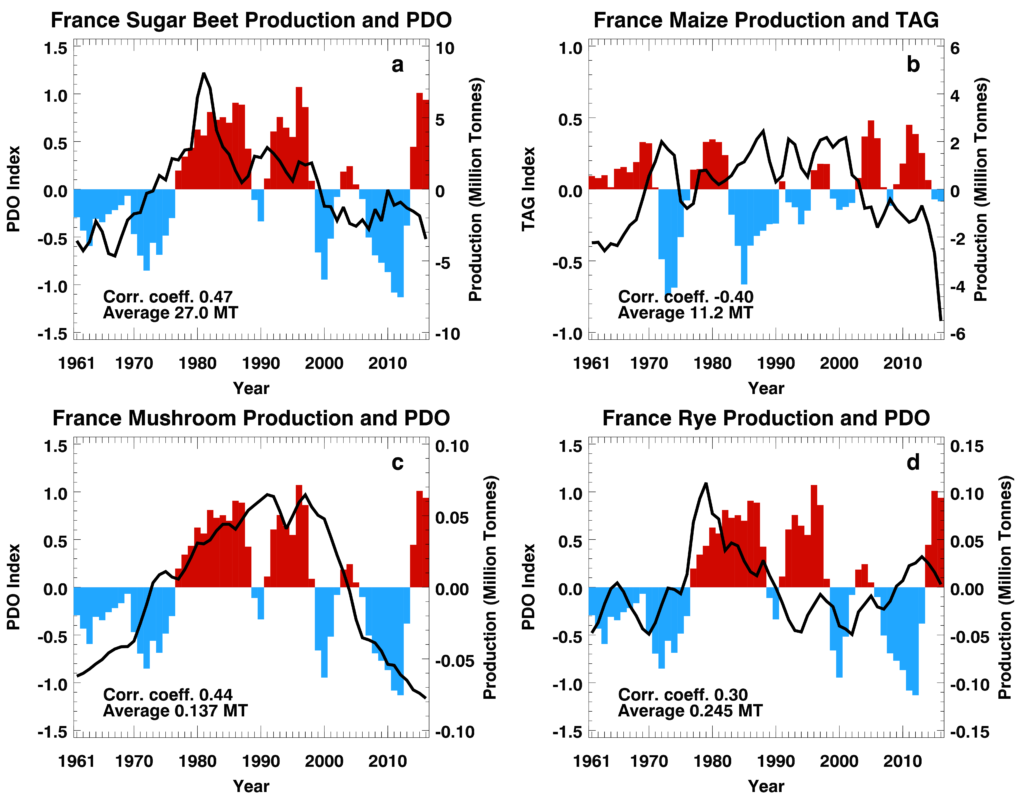 Time series of annual decadal climate variability indices (bars; left scale) and annual production (black line; right scale) in France during 1961 to 2016. Departures, smoothed by a 3-point moving-window filter, from average production are plotted. The average production and correlation coefficient between the two smoothed time series are shown; MT – million tonnes, TT – thousand tonnes. (a) Sugar beet and PDO, (b) maize (corn) and TAG, (c) mushroom and PDO, and (d) rye and PDO.
India has the second largest arable land area in the world with over 60% of its agricultural area being rainfed. It is the largest or second largest producer of many agricultural crops. Approximately 50 to 60% of its workforce is employed in agriculture. India is among the top three cashew nuts producers in the world, with more than 60% of the world’s export of cashew nuts, and ranks ninth among the top ten orange producing countries, with a sizeable fraction of the production exported to other countries. There are generally three seasons in India’s agricultural calendar; kharif (autumn in Arabic), rabi (spring in Arabic), and summer. Corn is grown in both the kharif and summer seasons across India, soybeans are mainly grown during the kharif season, and rice is grown in various locations during all three seasons. The Pacific Decadal Oscillation (PDO) index and the Nino3.4 have the largest associations with Indian crop production.
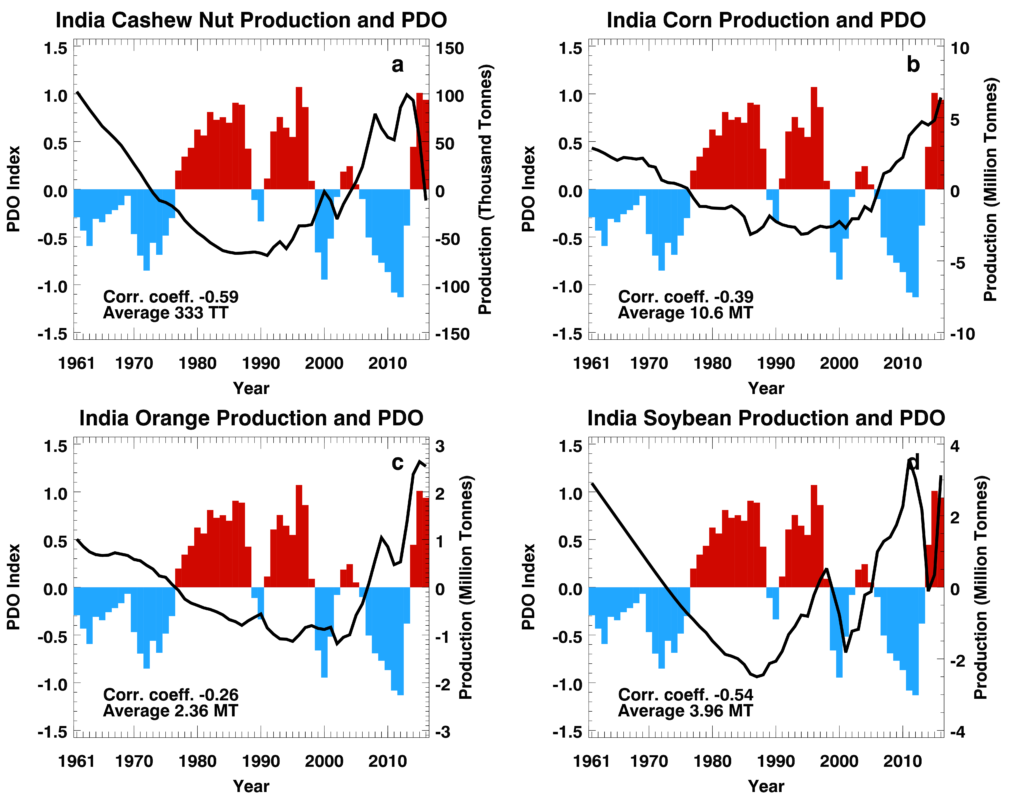 Time series of annual Pacific Decadal Oscillation index (bars; left scale) and annual production (black line; right scale) in India during 1961 to 2016. Departures, smoothed by a 3-point moving-window filter, from average production are plotted. The average production and correlation coefficient between the two smoothed time series are shown; MT – million tonnes, TT – thousand tonnes. (a) Cashew nut, (b) corn, (c) orange, and (d) soybean.
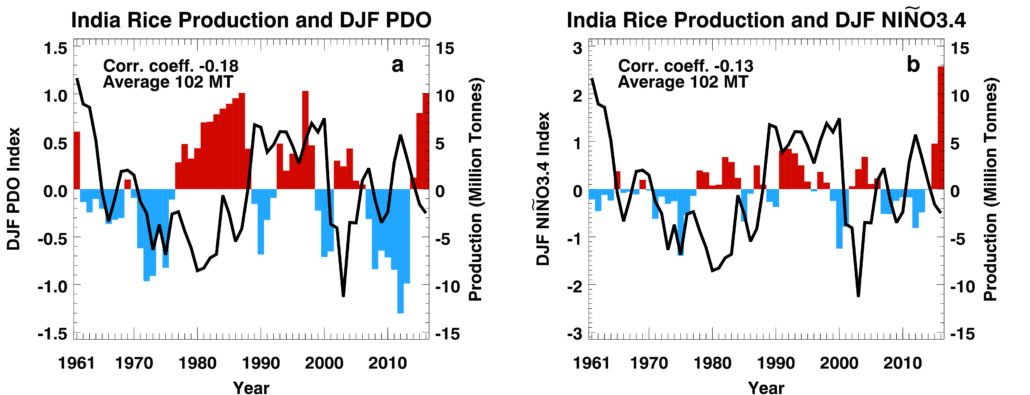 Time series of decadal climate variability indices (bars; left scale) and annual production (right scale) in India during 1961 to 2016. Departures, smoothed by a 3-point moving-window filter, from average production are plotted. The average production and correlation coefficient between the two smoothed time series are shown; MT – million tonnes. (a) Rice and DJF PDO, (b) Rice and DJF Niño3.4.
The Nigerian agricultural system is rain-fed and small-scale. It employs approximately 70% of the population. Nigeria is the world’s fourth largest producer of cocoa beans and one of the nation’s largest foreign exchange earners. It is also sub-Saharan Africa’s largest soybeans consumer for both human and poultry food. The Pacific Decadal Oscillation (PDO) index has substantial associations with crop production throughout Nigeria.
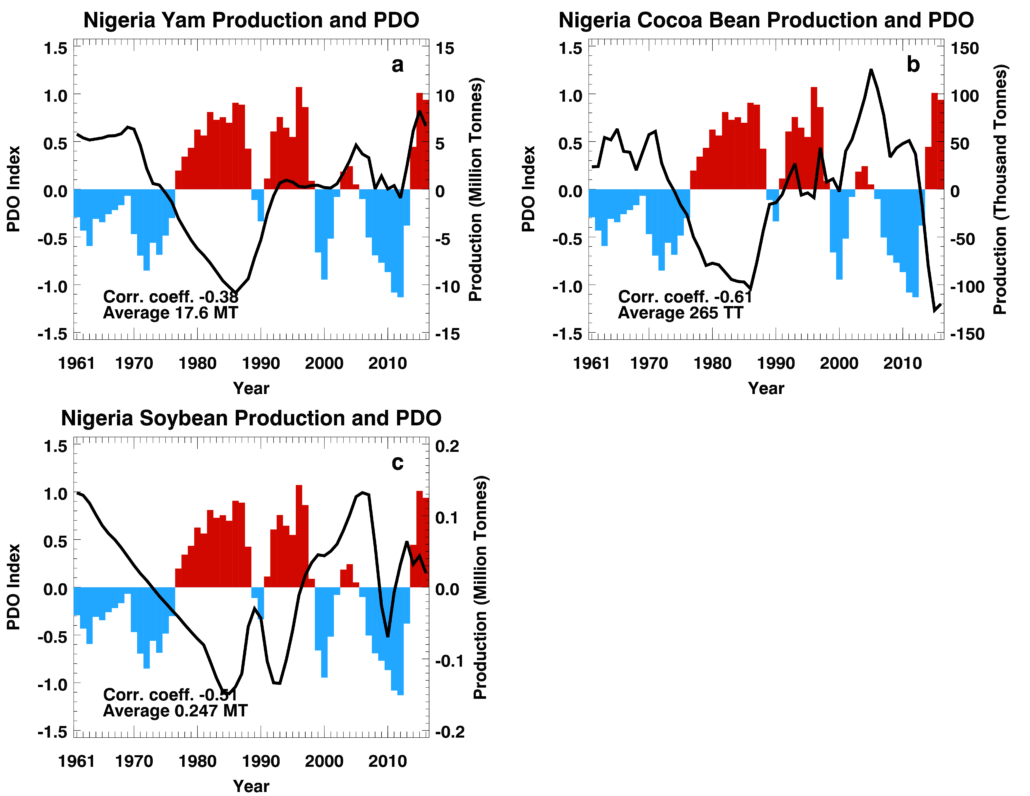 Time series of annual Pacific Decadal Oscillation index (bars; left scale) and annual production (black line; right scale) in Nigeria during 1961 to 2016. Departures, smoothed by a 3-point moving-window filter, from average production are plotted. The average production and correlation coefficient between the two smoothed time series are shown; MT – million tonnes, TT – thousand tonnes. (a) Yam, (b) cocoa bean, and (c) soybean.
Agriculture contributes approximately 17% to 25% to Syria’s economy and approximately 17% of the work force is in the agriculture sector. Twenty-eight percent of land is cultivated, out of which only 21% is irrigated. Therefore, Syrian agriculture is almost entirely rain-fed, and so at the mercy of vagaries of nature and highly vulnerable to climate variability. Major crops in Syria are barley, wheat, vegetables, and grapes. Vegetables were the largest agricultural export of Syria in the early 2000s, and Syria was the third largest producer of grapes among Arab countries in 2009, with the crop grown in all major administrative areas. The Pacific Decadal Oscillation (PDO) index has substantial associations with crop production across this war-torn country. The current civil war in Syria began in 2011; with the possibility of different areas being controlled by different warring factions or the government, data beyond 2010 was not used.
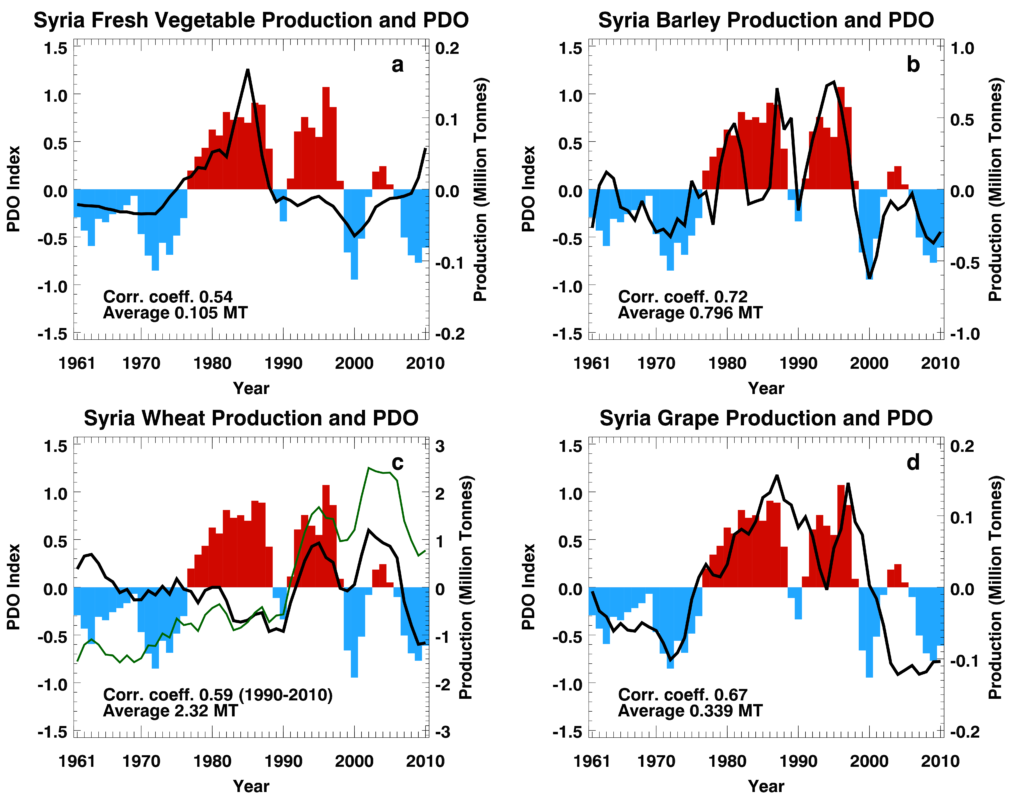 Time series of annual Pacific Decadal Oscillation index (bars; left scale) and annual production (black line; right scale) in Syria during 1961 to 2010. Departures, smoothed by a 3-point moving-window filter, from average production are plotted. The average production and correlation coefficient between the two smoothed time series are shown; MT – million tonnes, TT – thousand tonnes. (a) Vegetables and PDO, (b) barley and PDO, (c) non-detrended wheat (green line), detrended wheat (black line), and PDO, and (d) grape and PDO.
The United States of America is the world’s 5th largest avocado producer, the 4th largest wheat producer, and the 10th largest barley producer. Beer is a derived food product from grains and other crops, with barley as a major ingredient of a substantial quantity of the beer produced in the U.S.A. The Pacific Decadal Oscillation (PDO) index has substantial correlations with production of many crops across the U.S.A..
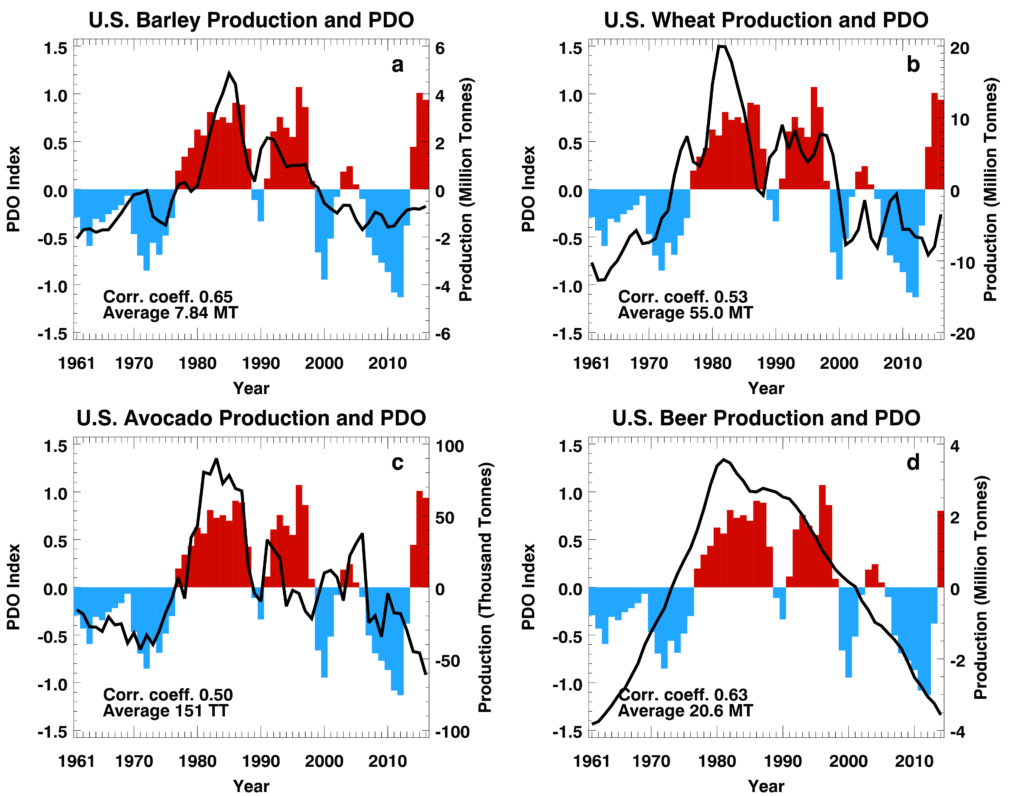 Time series of annual Pacific Decadal Oscillation index (bars; left scale) and annual production (black line; right scale) in the U.S.A. during 1961 to 2016 (2014 for beer). Departures, smoothed by a 3-point moving-window filter, from average production are plotted. The average production and correlation coefficient between the two smoothed time series are shown; MT – million tonnes, TT – thousand tonnes. (a) Barley, (b) wheat, (c) avocado, and (d) beer.
Major conclusions of these and other analyses are:
- Analyses of 400 crop-country combinations (20 crops x 20 countries) show that variations in annual productions of major crops, especially in non-irrigated regions in major food-producing countries and subsistence-agriculture countries, are associated with the PDO, the TAG variability, and other DCV phenomena. In some crop-country combinations, differences in productions were found to be as large as 40% (of long-term average production) between opposite phases of DCV phenomena. These results have very important implications for national, regional, and worldwide food securities as shown in (Mehta, 2017).