Correlation maps between decadal climate variability (DCV) indices and global hydro-meteorology variables (precipitation and temperature) on annual and seasonal timescales are here.
We use two gridded precipitation datasets to estimate the associations between DCV phenomena. These datasets are the Global Precipitation Climatology Centre (GPCC) and the Integrated Multi-satellite Retrievals for GPM (IMERG). GPCC data used are from January 1951 through December 2018 on a global resolution of 1° x 1°. The dataset is updated regularly with a two to three month lag.
The IMERG data used are from June 2000 through the current day of the current month on a global resolution of 10km x 10km. The IMERG data are processed at timescales of every 30 minutes to every monthly. The monthly version (IMERGM) is calibrated with the GPCC data, therefore also has a two to three month lag in availability. The daily IMERG version (IMERGDL) is processed after the last observation of the day therefore is available the next day. The IMERGDL is readily available at the current time, so it will be used in place of the IMERGM in the lagged months for the present conditions. Accordingly, GPCC and IMERGM correlations are used to display past conditions, and both IMERGM and IMERGDL will be used for present conditions.
Global temperature data from January 1951 through December 2018 from NCEP/NCAR Reanalysis 1 were used.
You can find here the global IMERGM (2000-2017) and GPCC (1961-2010) precipitation, and temperature (1961-2010) climatology.
Annual and seasonal global correlations between DCV indices and hydro-meteorological variables can be displayed.
Choose a variable/DCV combination to display:
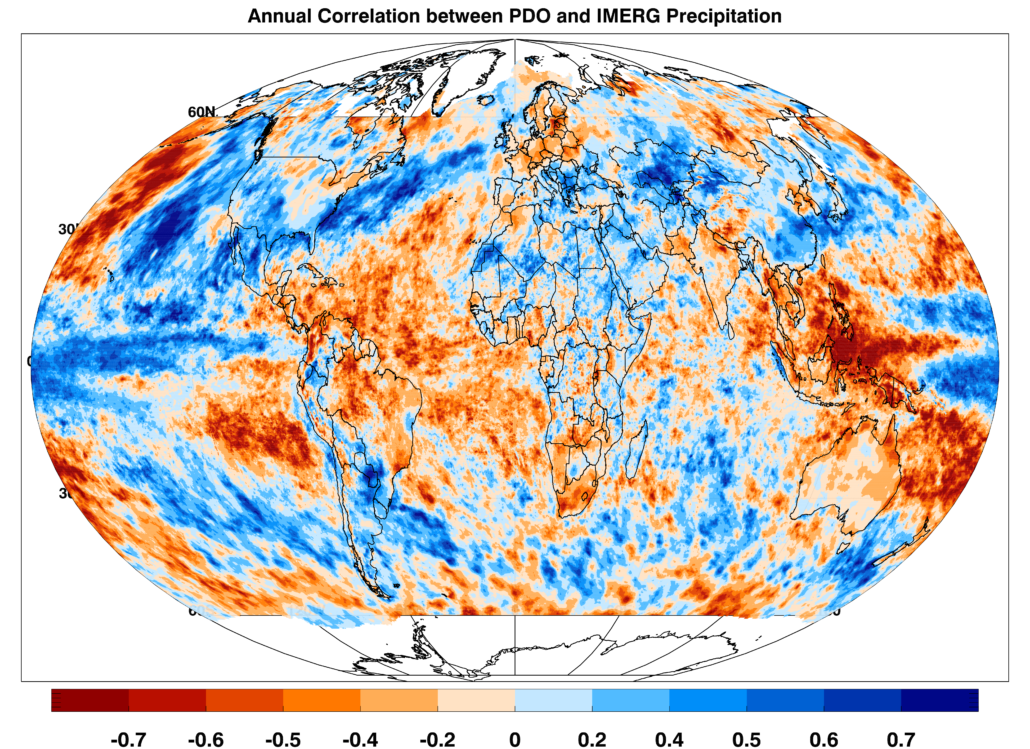
Precipitation and PDO Correlations
Annual and seasonal correlation maps between the Pacific Decadal Oscillation (PDO) and global precipitation [GPCC from 1951-2018 and IMERG from 2001-2018] are shown. Any correlation above/below +/- 0.24 and +/- 0.4 respectively, are significant at the 95% significance threshold using a t-test score.
Positive correlation (blue) result from either positive PDO and above average precipitation, or negative PDO and below average precipitation. Negative correlation (red) result from either positive PDO and below average precipitation, or negative PDO and above average precipitation.
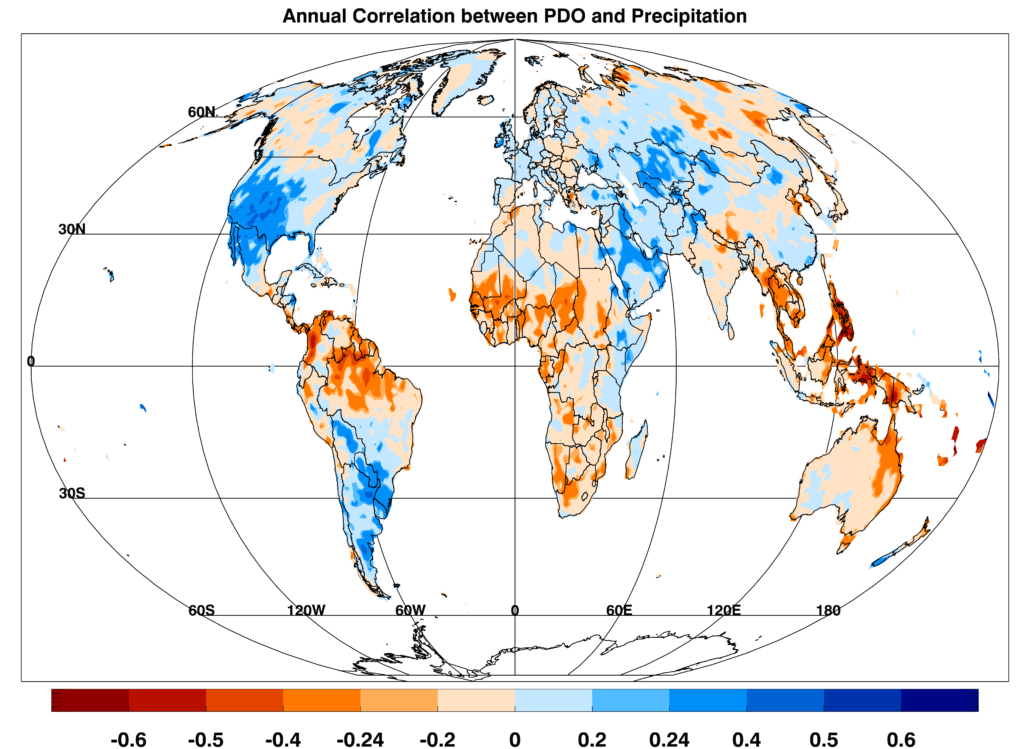
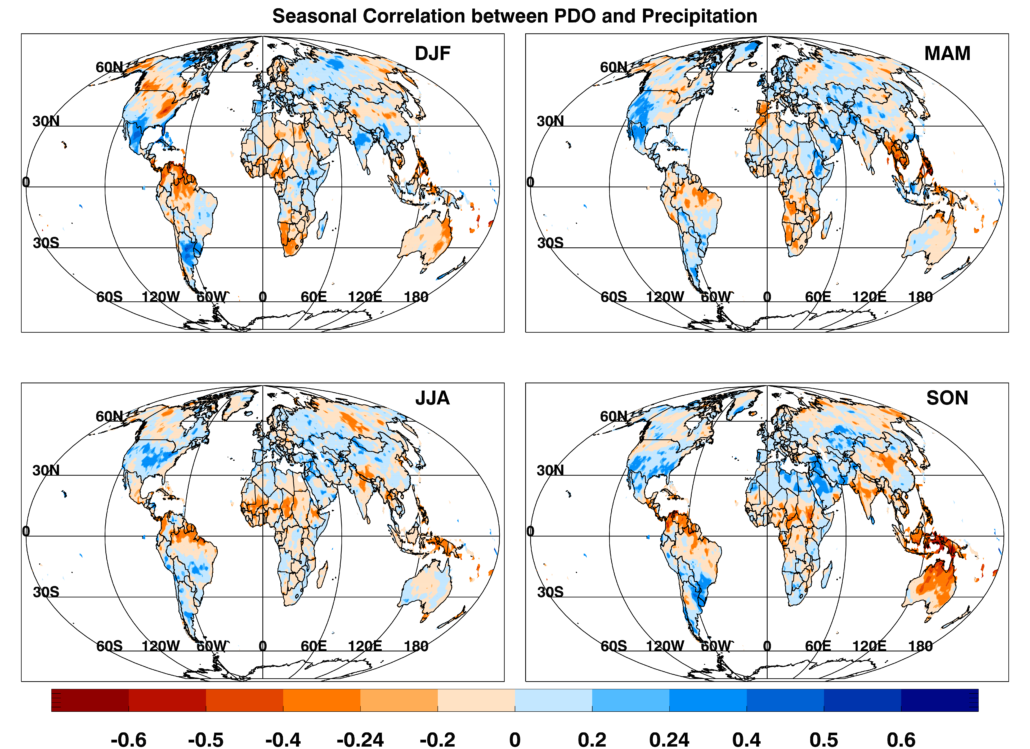
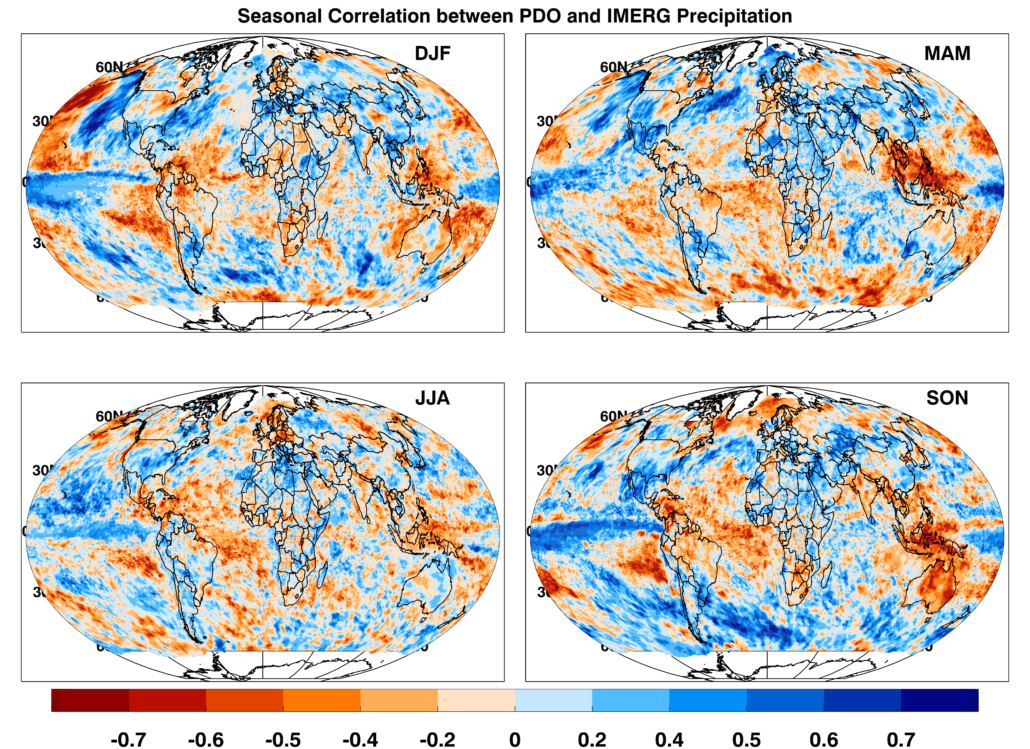
Dec-Jan-Feb (DJF), Mar-Apr-May (MAM), Jun-Jul-Aug (JJA), and Sep-Oct-Nov (SON).
Precipitation and TAG Correlations
Annual and seasonal correlation maps between the Tropical Atlantic SST gradient (TAG) variability and global precipitation [GPCC from 1951-2018 and IMERG from 2001-2018] are shown. Any correlation above/below +/- 0.24 and +/- 0.4 respectively, are significant at the 95% significance threshold using a t-test score.
Positive correlation (blue) result from either positive TAG and above average precipitation, or negative TAG and below average precipitation. Negative correlation (red) result from either positive TAG and below average precipitation, or negative TAG and above average precipitation.
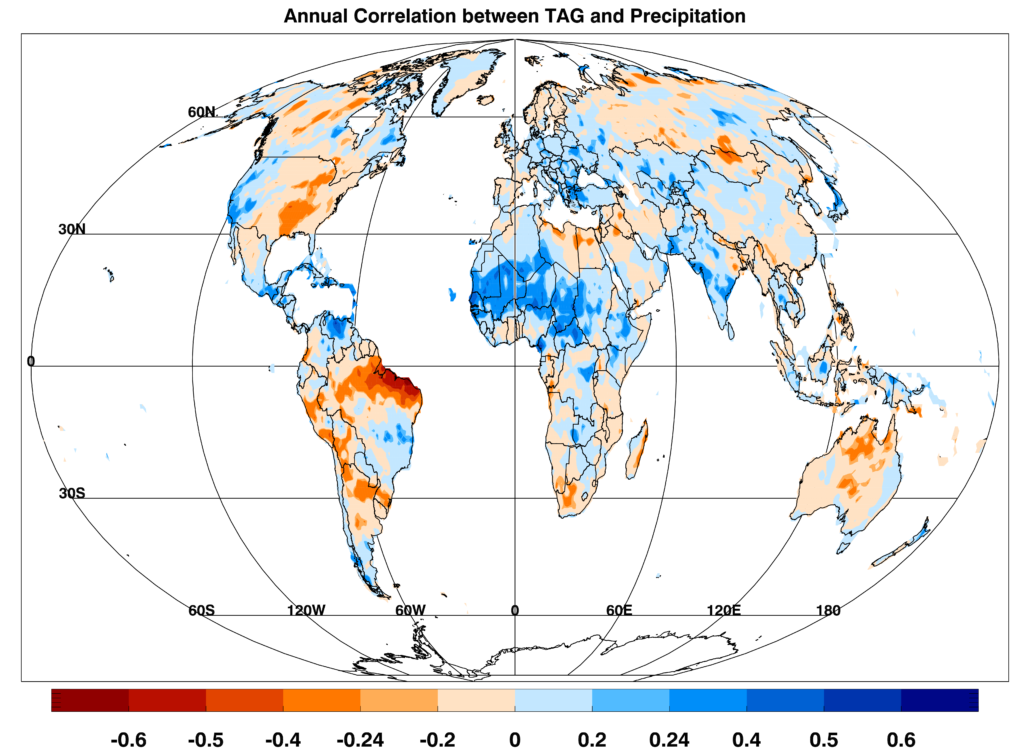

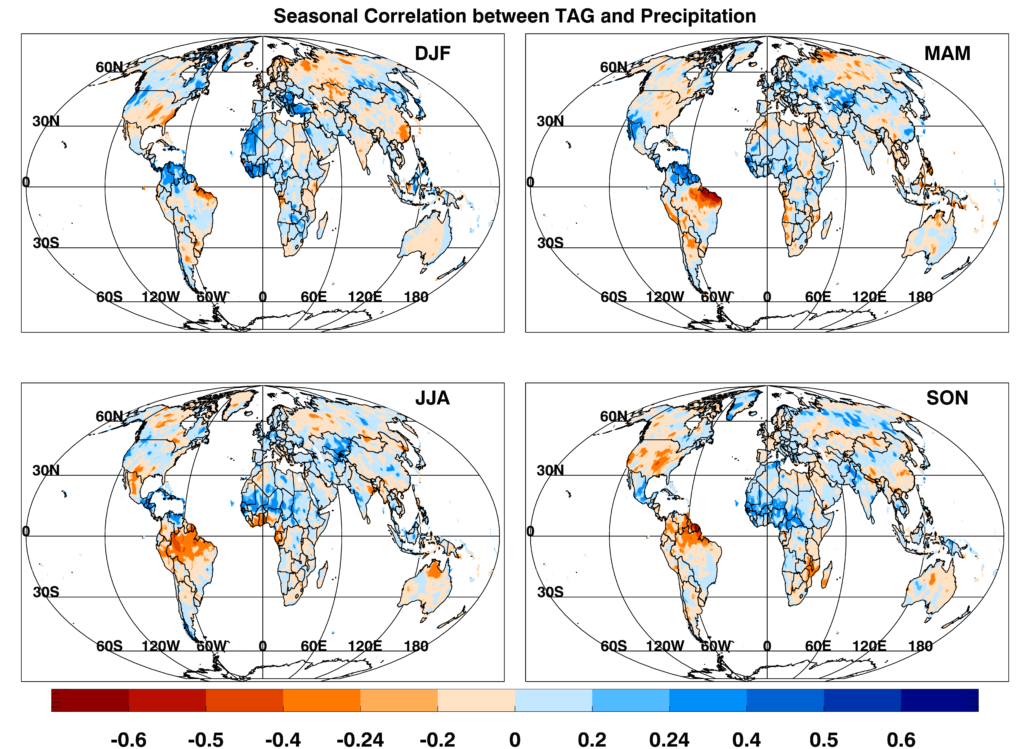
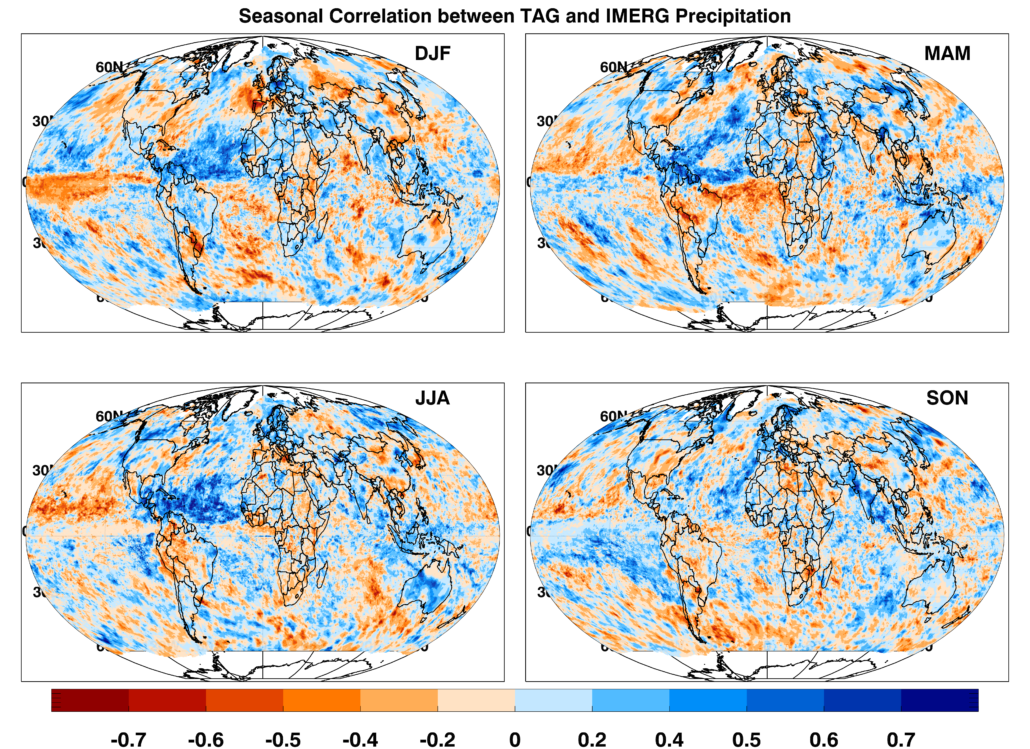
Dec-Jan-Feb (DJF), Mar-Apr-May (MAM), Jun-Jul-Aug (JJA), and Sep-Oct-Nov (SON).
Precipitation and Detrended WPWP Correlations
Annual and seasonal correlation maps between the detrended West Pacific Warm Pool (WPWP) index and global precipitation [GPCC from 1951-2018 and IMERG from 2001-2018] are shown. WPWP index was detrended before calculating correlation coefficients because it has a pronounced linear trend. Any correlation above/below +/- 0.24 and +/- 0.4 respectively, are significant at the 95% significance threshold using a t-test score.
Positive correlation (blue) result from either positive WPWP and above average precipitation, or negative WPWP and below average precipitation. Negative correlation (red) result from either positive WPWP and below average precipitation, or negative WPWP and above average precipitation.
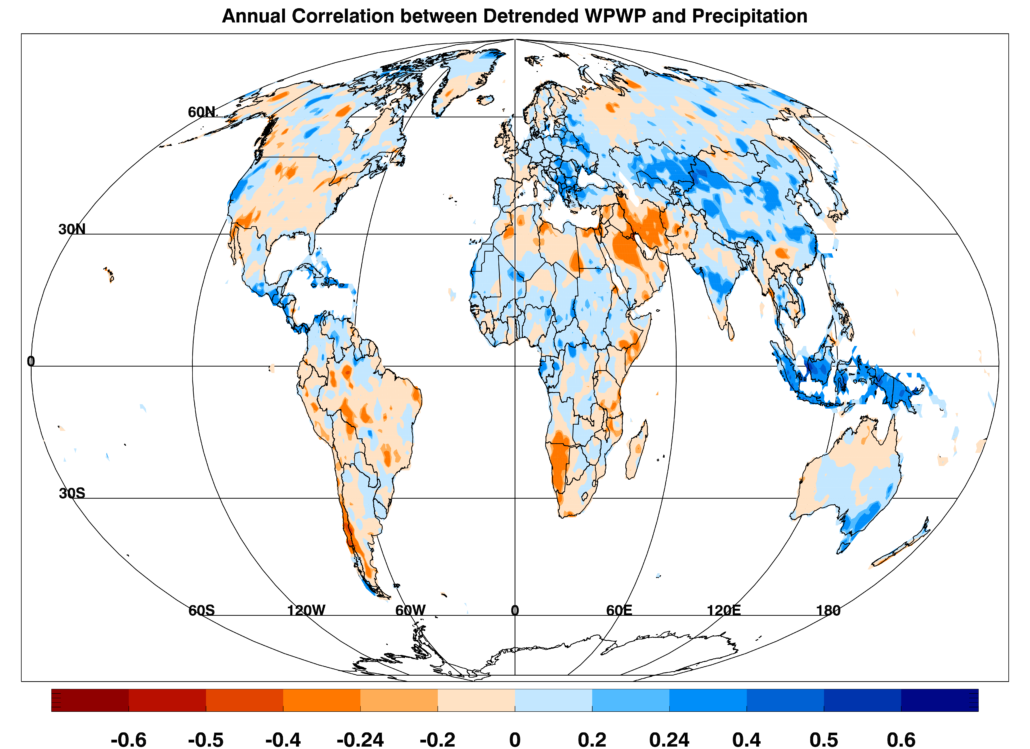
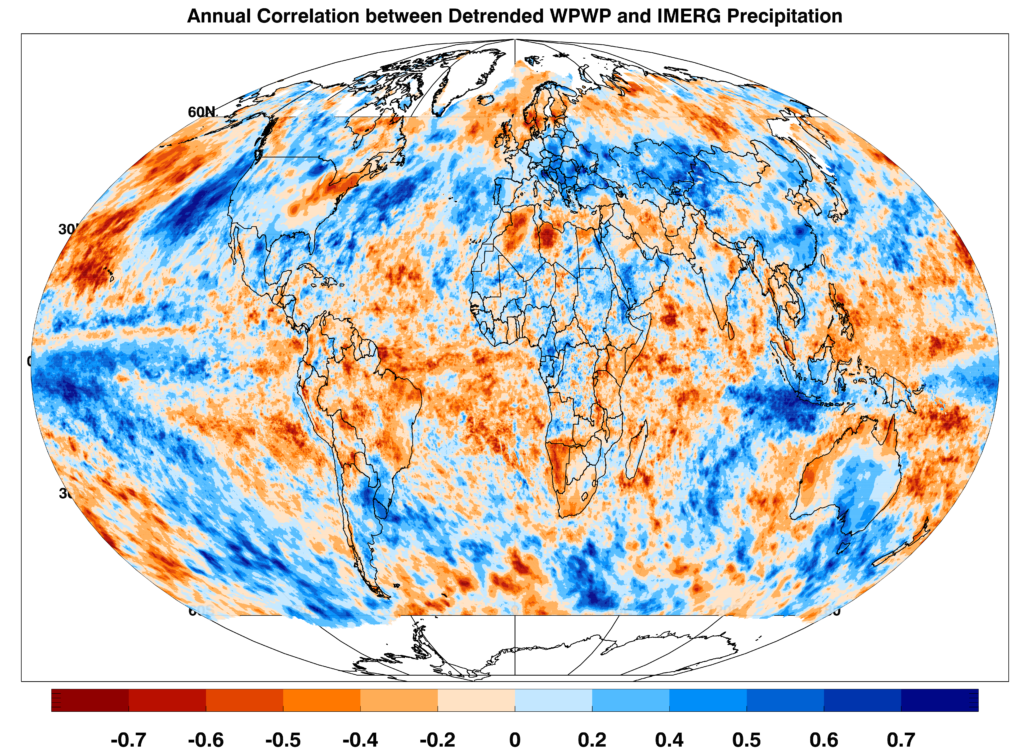
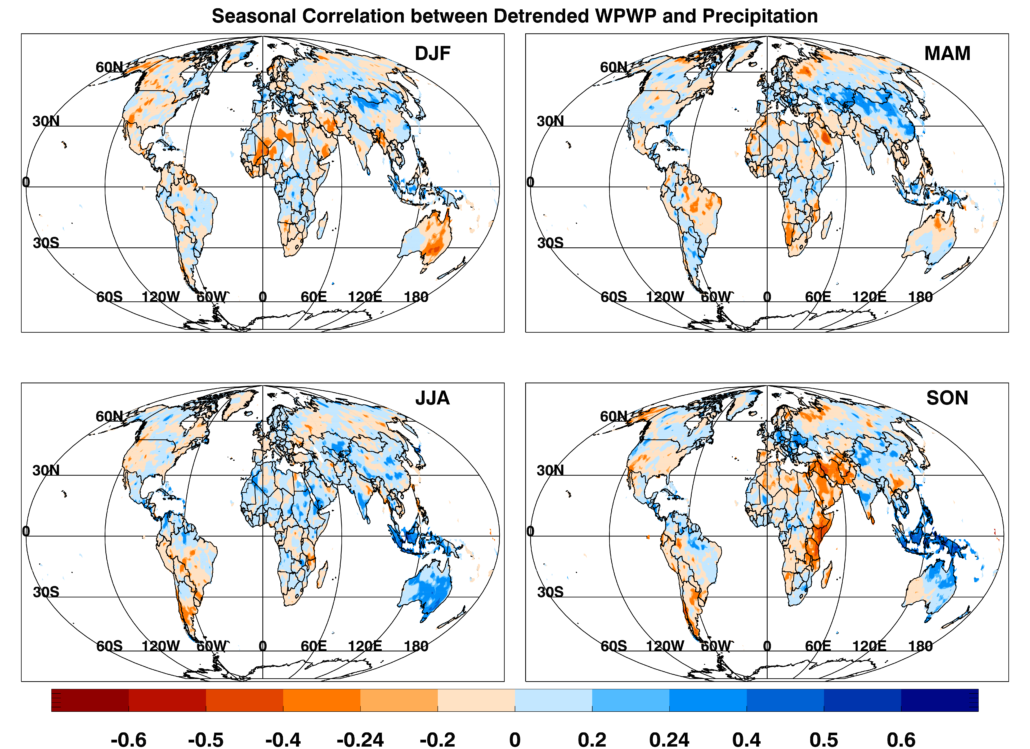
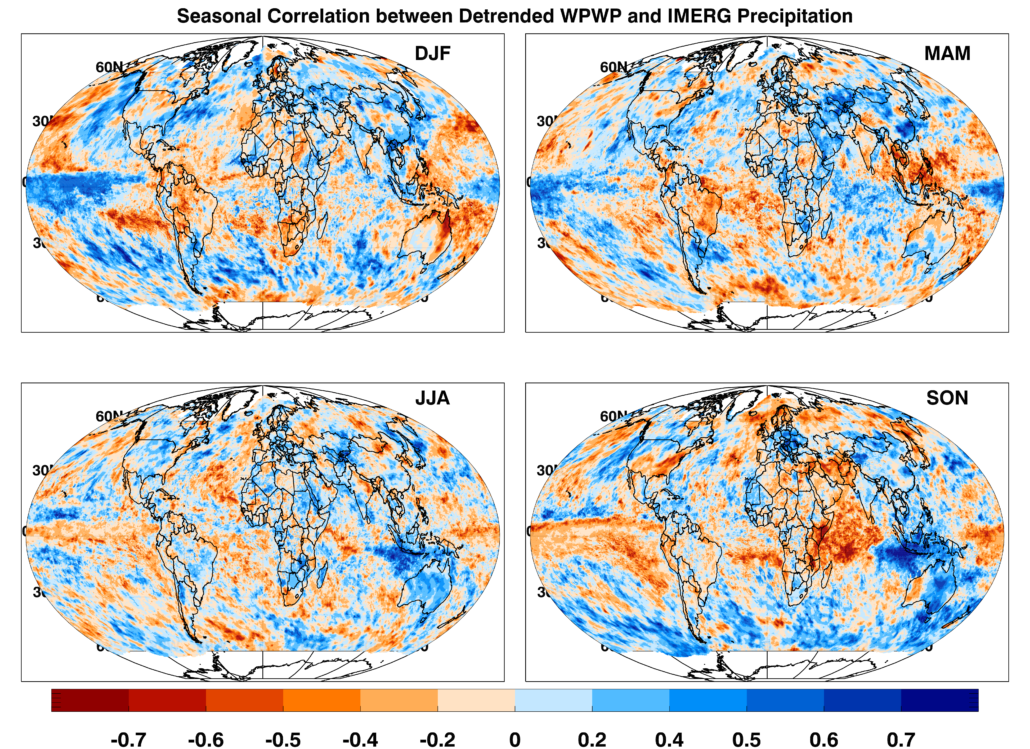
Dec-Jan-Feb (DJF), Mar-Apr-May (MAM), Jun-Jul-Aug (JJA), and Sep-Oct-Nov (SON).
Precipitation and Detrended EIWP Correlations
Annual and seasonal correlation maps between the detrended East Indian Warm Pool (EIWP) index and global precipitation [GPCC from 1951-2018 and IMERG from 2001-2018] are shown. EIWP index was detrended before calculating correlation coefficients because it has a pronounced linear trend. Any correlation above/below +/- 0.24 and +/- 0.4 respectively, are significant at the 95% significance threshold using a t-test score.
Positive correlation (blue) result from either positive EIWP and above average precipitation, or negative EIWP and below average precipitation. Negative correlation (red) result from either positive EIWP and below average precipitation, or negative EIWP and above average precipitation.
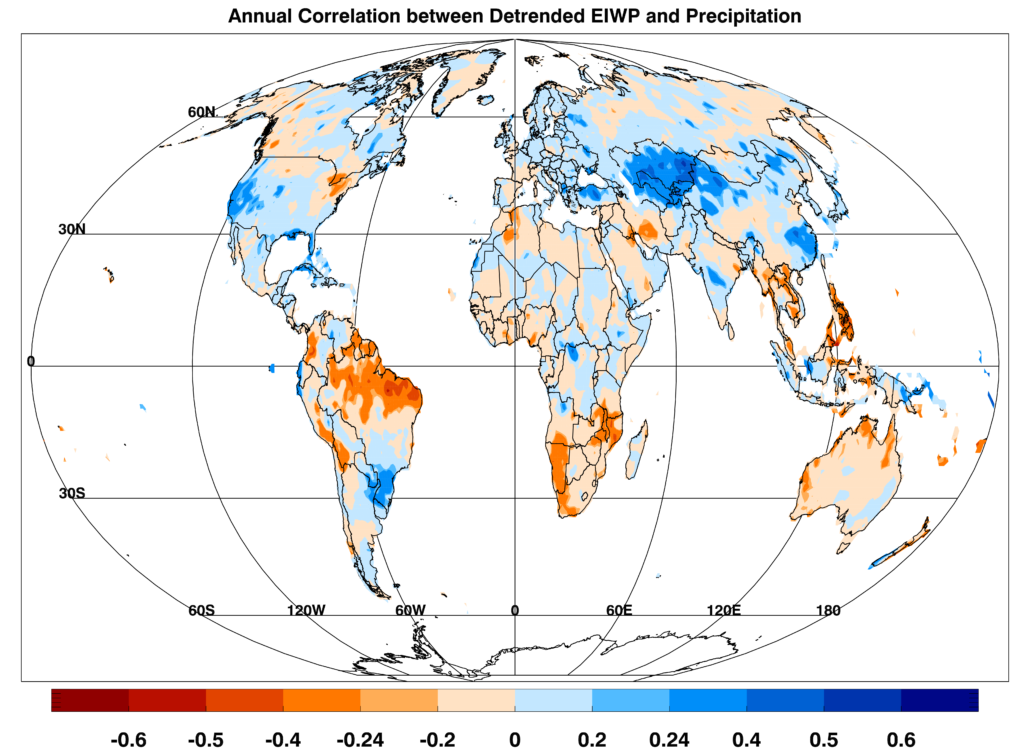

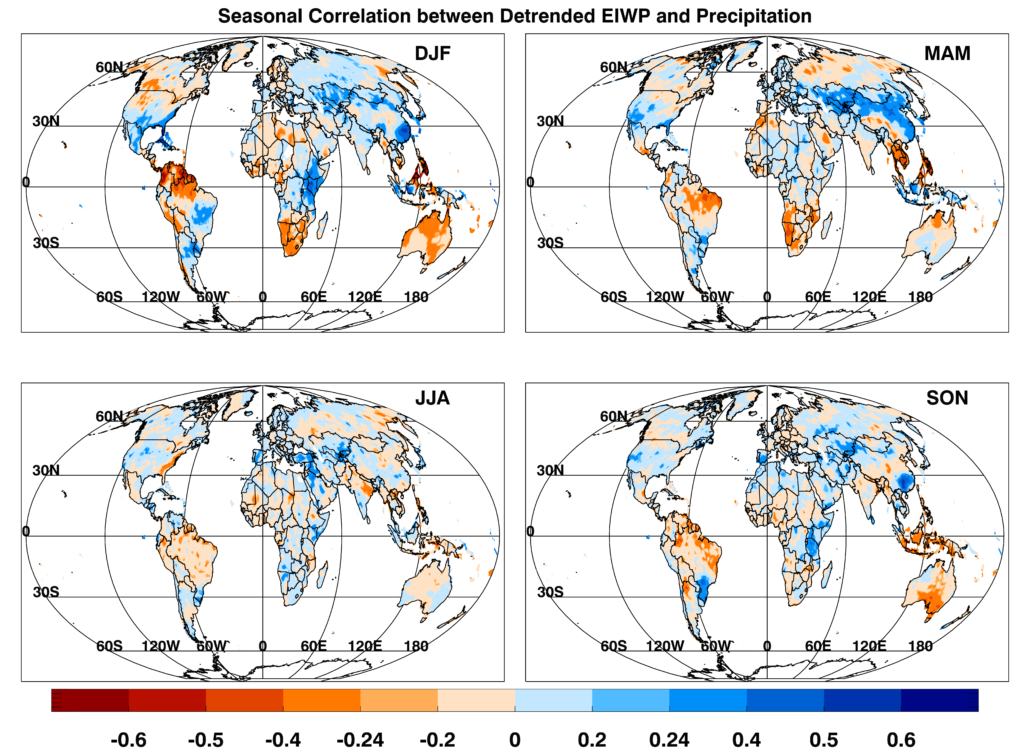
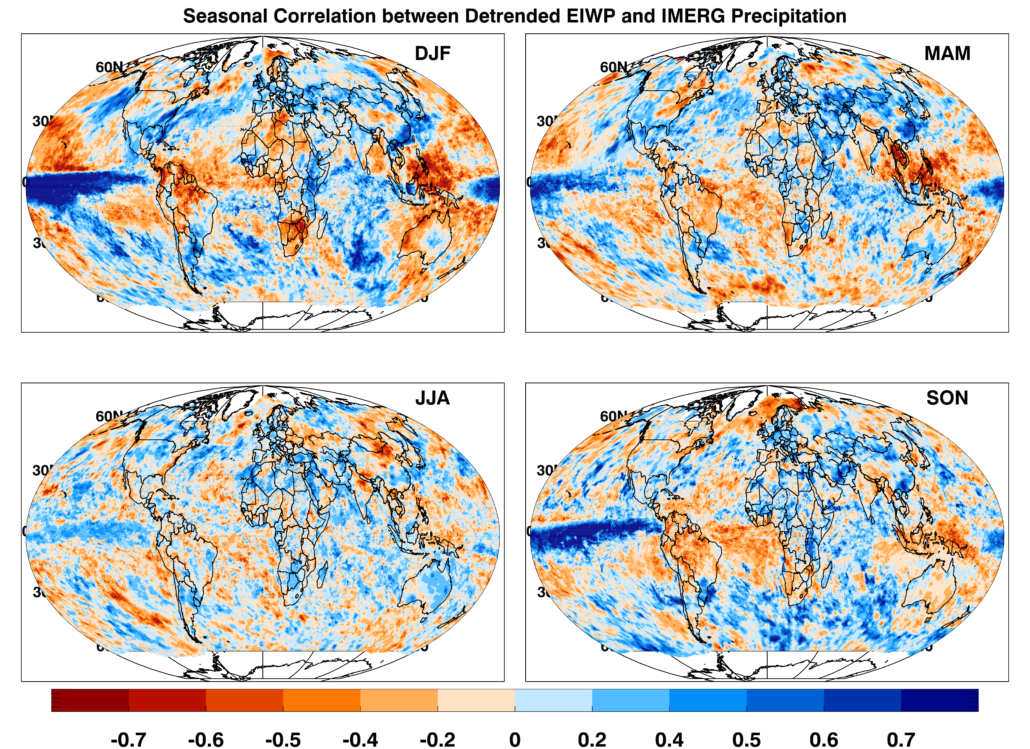
Dec-Jan-Feb (DJF), Mar-Apr-May (MAM), Jun-Jul-Aug (JJA), and Sep-Oct-Nov (SON).
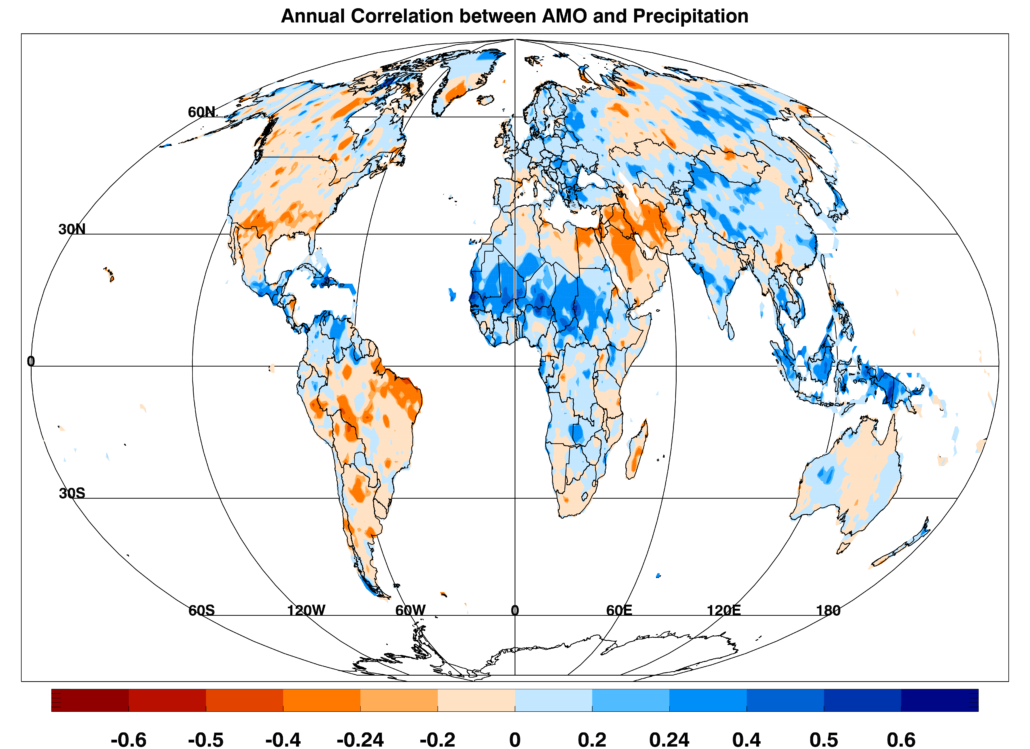
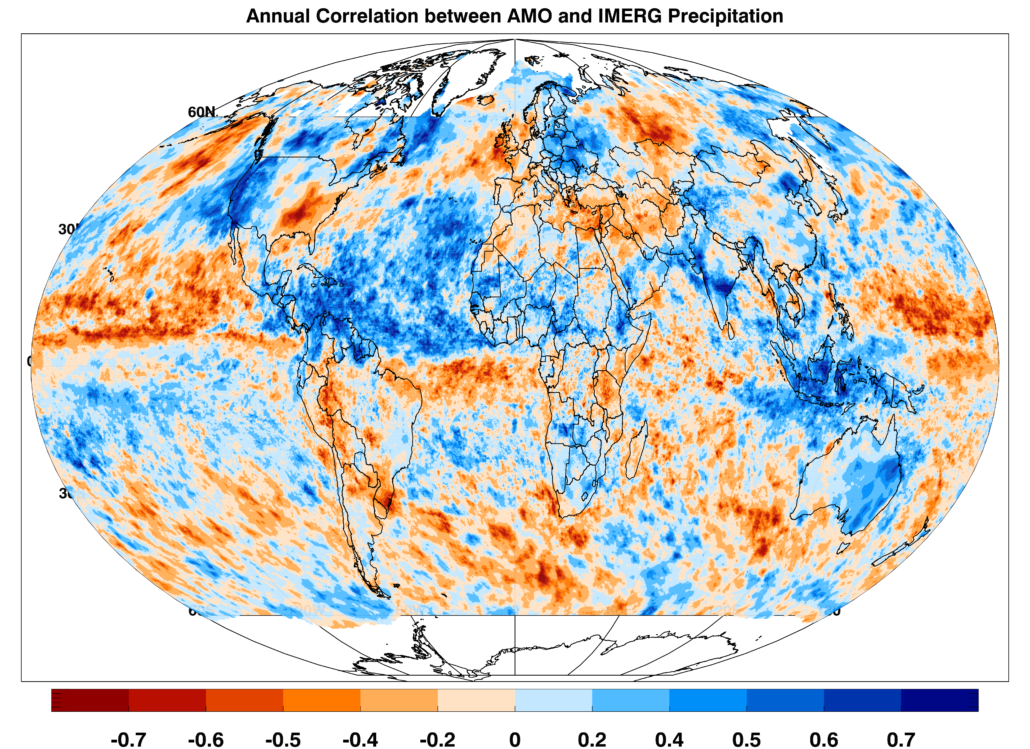
Precipitation and AMO Correlations
Annual and seasonal correlation maps between the Atlantic Multidecadal Oscillation (AMO) and global precipitation [GPCC from 1951-2018 and IMERG from 2001-2018] are shown. Any correlation above/below +/- 0.24 and +/- 0.4 respectively, are significant at the 95% significance threshold using a t-test score.
Positive correlation (blue) result from either positive AMO and above average precipitation, or negative AMO and below average precipitation. Negative correlation (red) result from either positive AMO and below average precipitation, or negative AMO and above average precipitation.
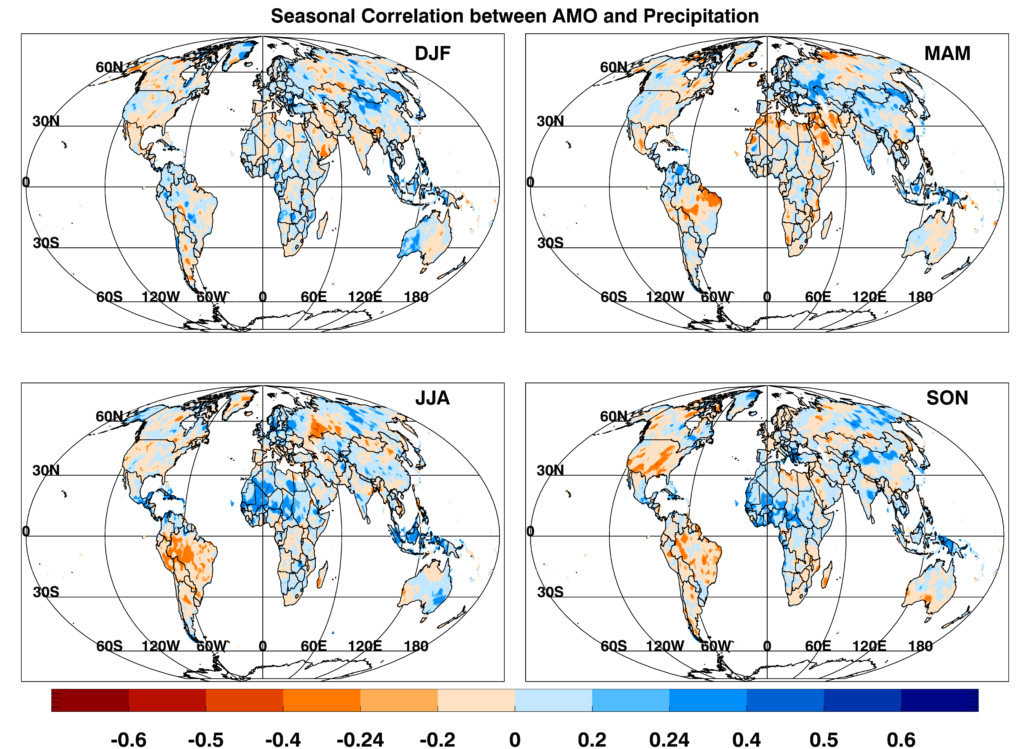
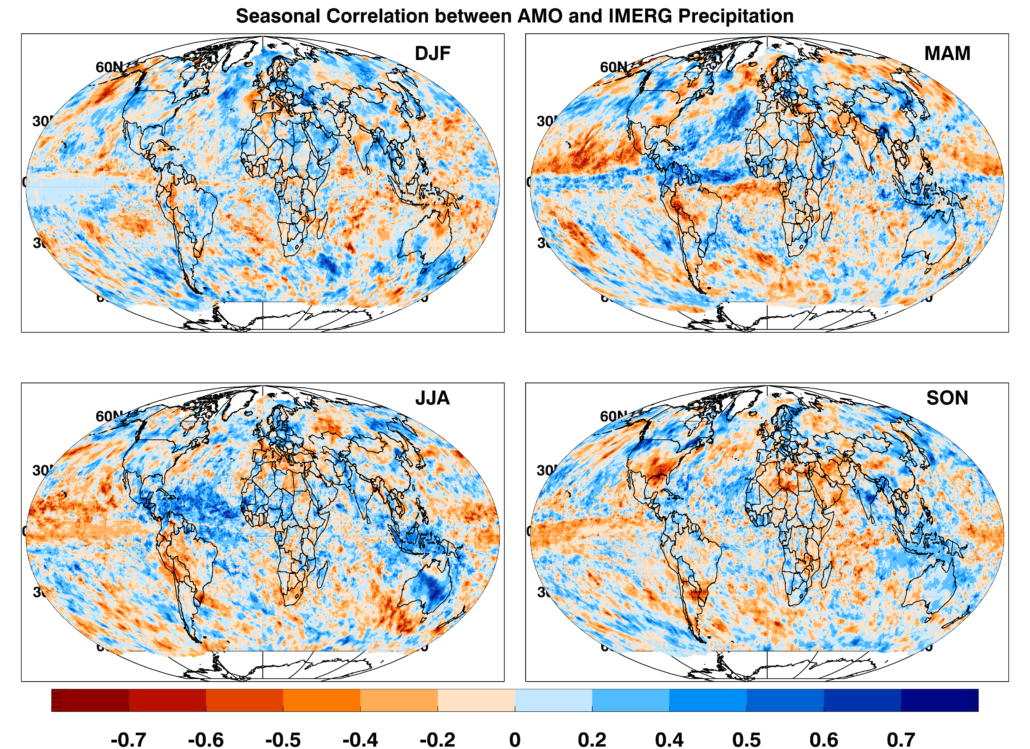
Dec-Jan-Feb (DJF), Mar-Apr-May (MAM), Jun-Jul-Aug (JJA), and Sep-Oct-Nov (SON).
Precipitation and Niño3.4 Correlations
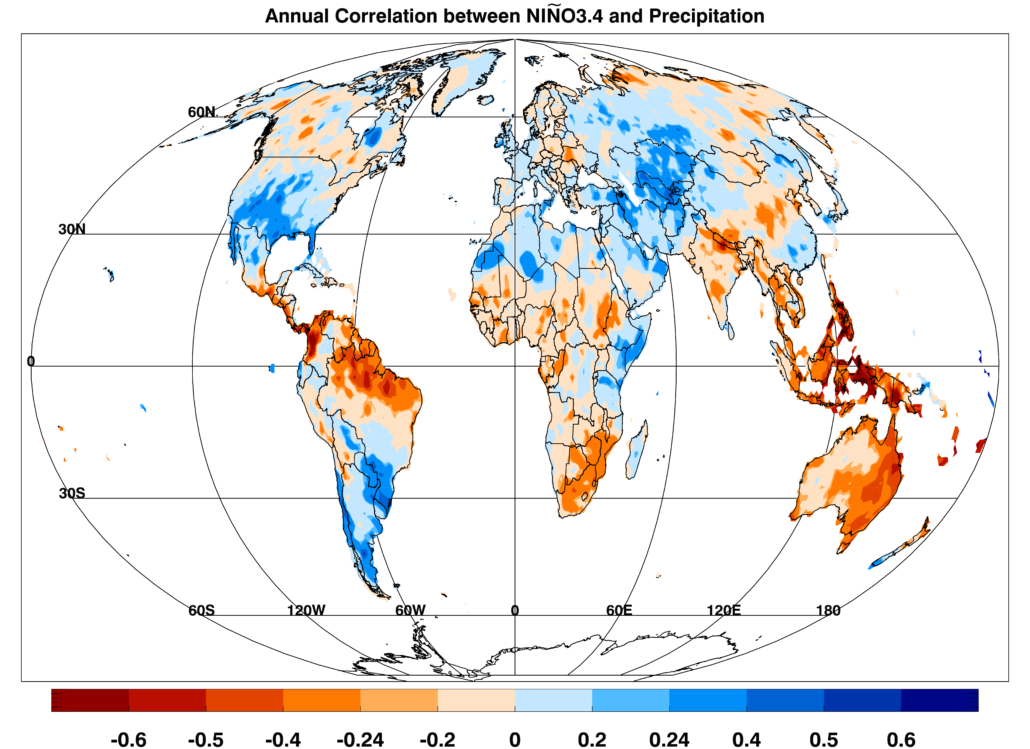
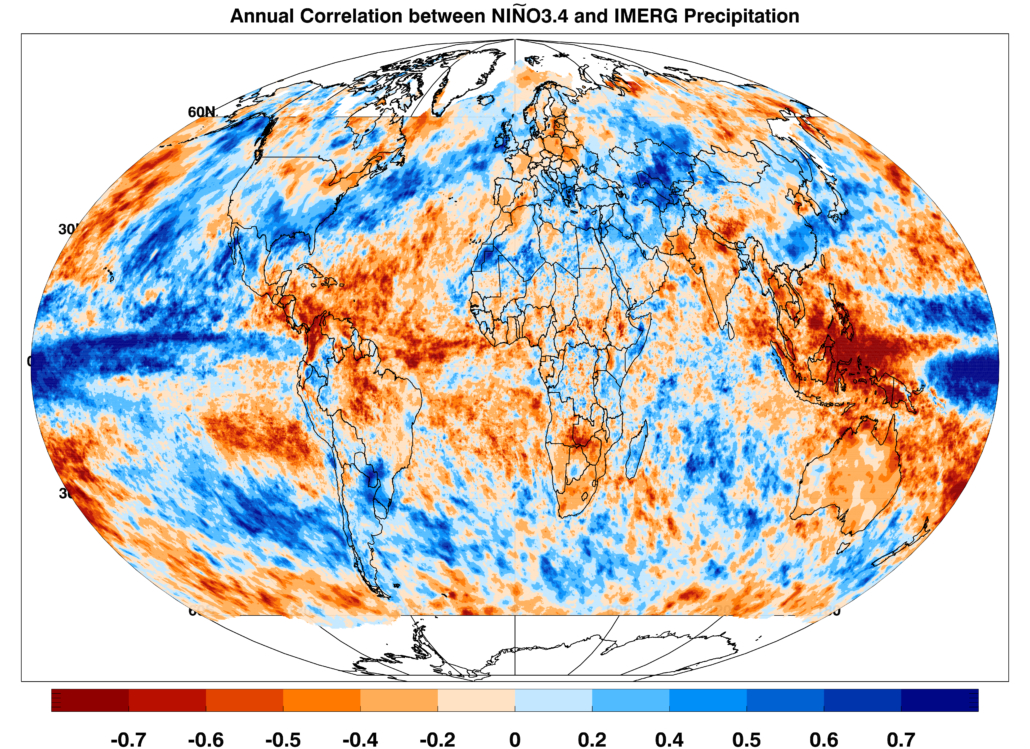
Annual and seasonal correlation maps between the Niño3.4 index and global precipitation [GPCC from 1951-2018 and IMERG from 2001-2018] are shown. Any correlation above/below +/- 0.24 and +/- 0.4 respectively, are significant at the 95% significance threshold using a t-test score.
Positive correlation (blue) result from either positive Niño3.4 index and above average precipitation, or negative Niño3.4 and below average precipitation. Negative correlation (red) result from either positive Niño3.4 and below average precipitation, or negative Niño3.4 and above average precipitation.
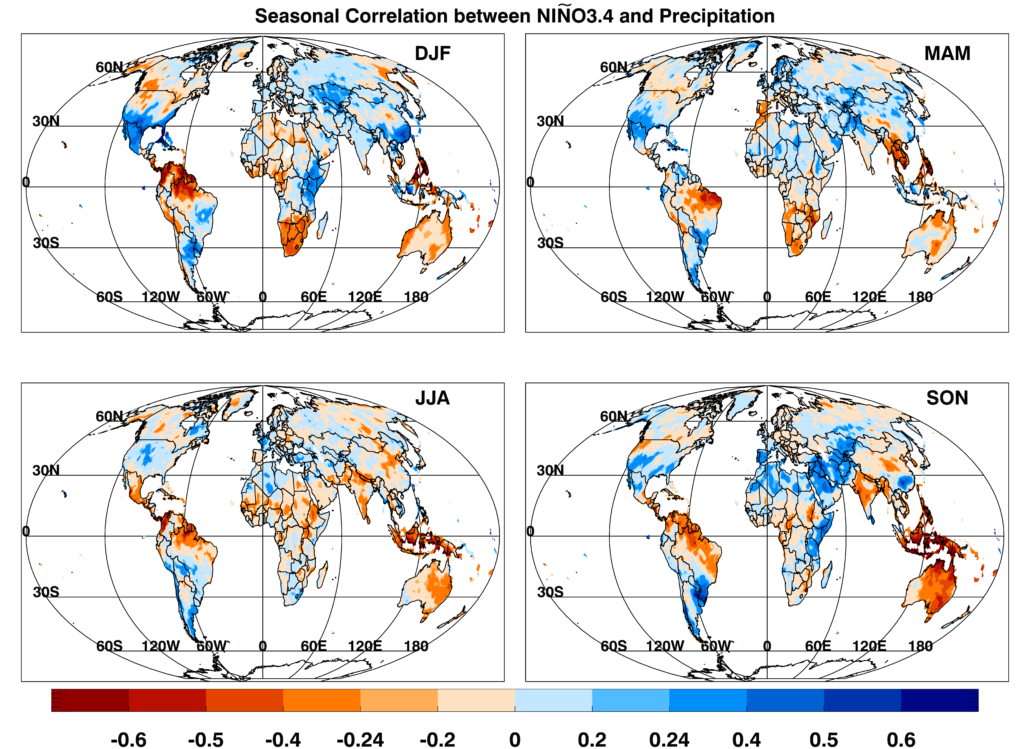
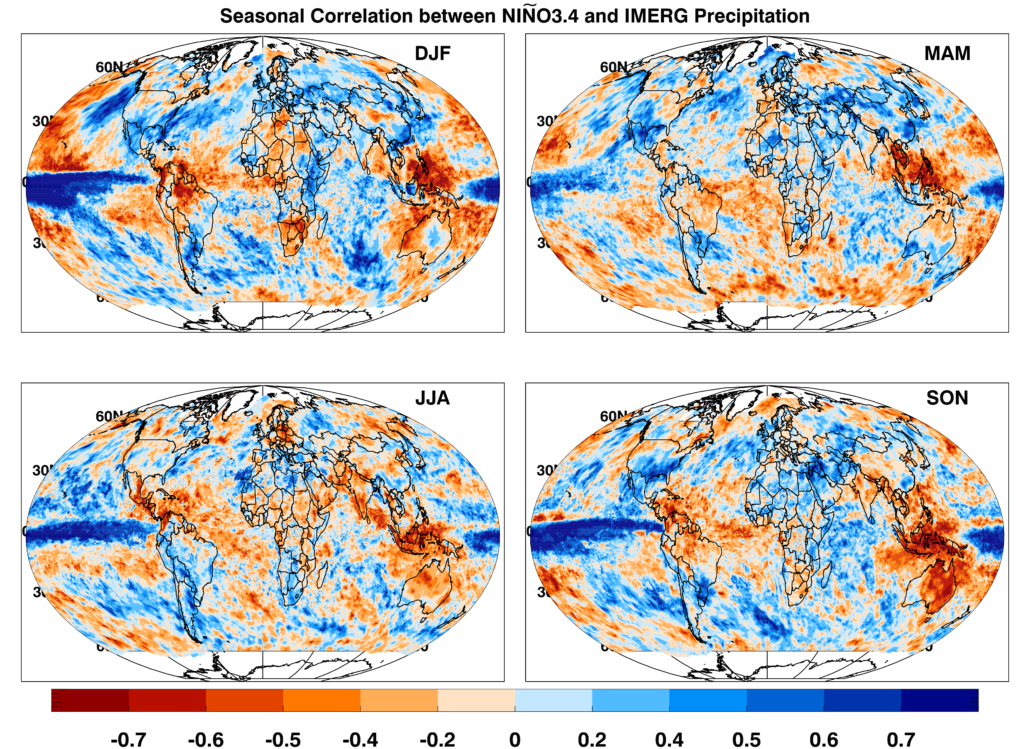
Dec-Jan-Feb (DJF), Mar-Apr-May (MAM), Jun-Jul-Aug (JJA), and Sep-Oct-Nov (SON).
Temperature and PDO Correlations
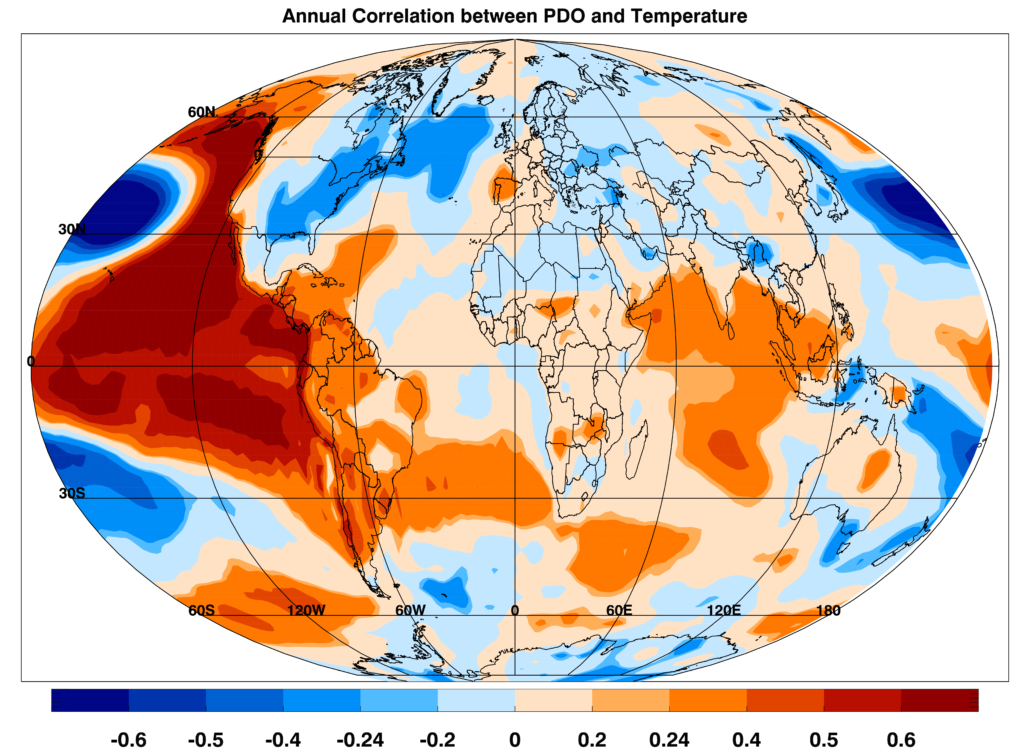
Annual and seasonal correlation maps between the Pacific Decadal Oscillation (PDO) and global temperature from 1951-2018 are shown. Any correlation above/below +/- 0.24 is significant at the 95% significance threshold using a t-test score.
Positive correlation (red) result from either positive PDO and above average temperature, or negative PDO and below average temperature. Negative correlation (blue) result from either positive PDO and below average temperature, or negative PDO and above average temperature.
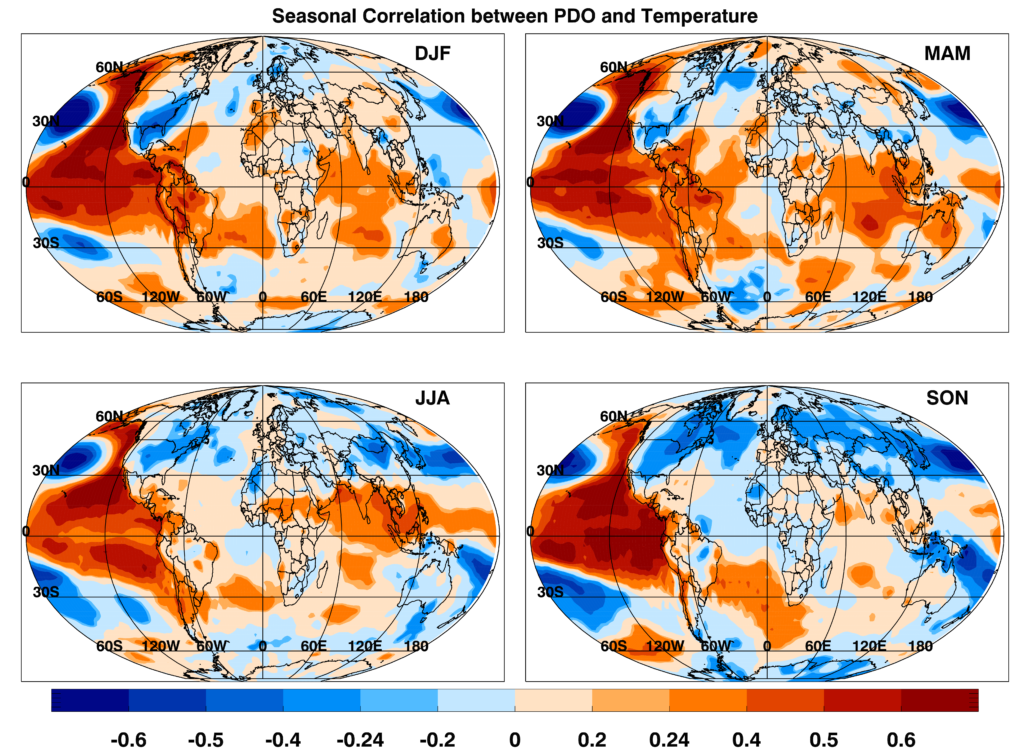
Dec-Jan-Feb (DJF), Mar-Apr-May (MAM), Jun-Jul-Aug (JJA), and Sep-Oct-Nov (SON).
Temperature and TAG Correlations
Annual and seasonal correlation maps between the Tropical Atlantic SST gradient (TAG) variability and global temperature from 1951-2018 are shown. Any correlation above/below +/- 0.24 is significant at the 95% significance threshold using a t-test score.
Positive correlation (red) result from either positive TAG and above average temperature, or negative TAG and below average temperature. Negative correlation (blue) result from either positive TAG and below average temperature, or negative TAG and above average temperature.
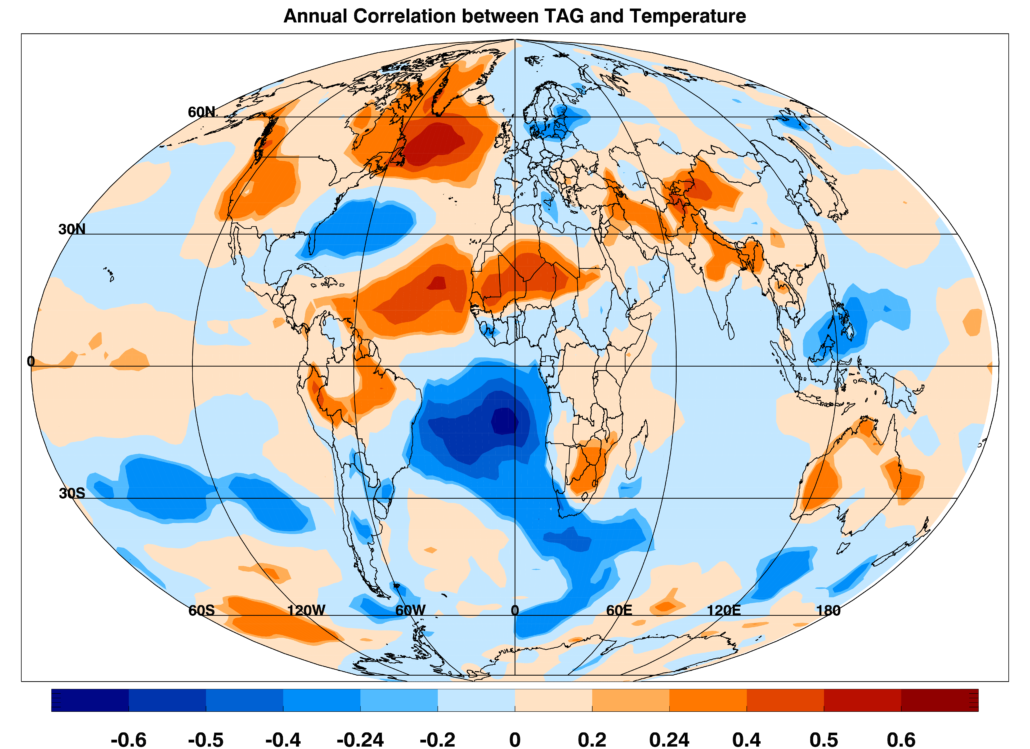
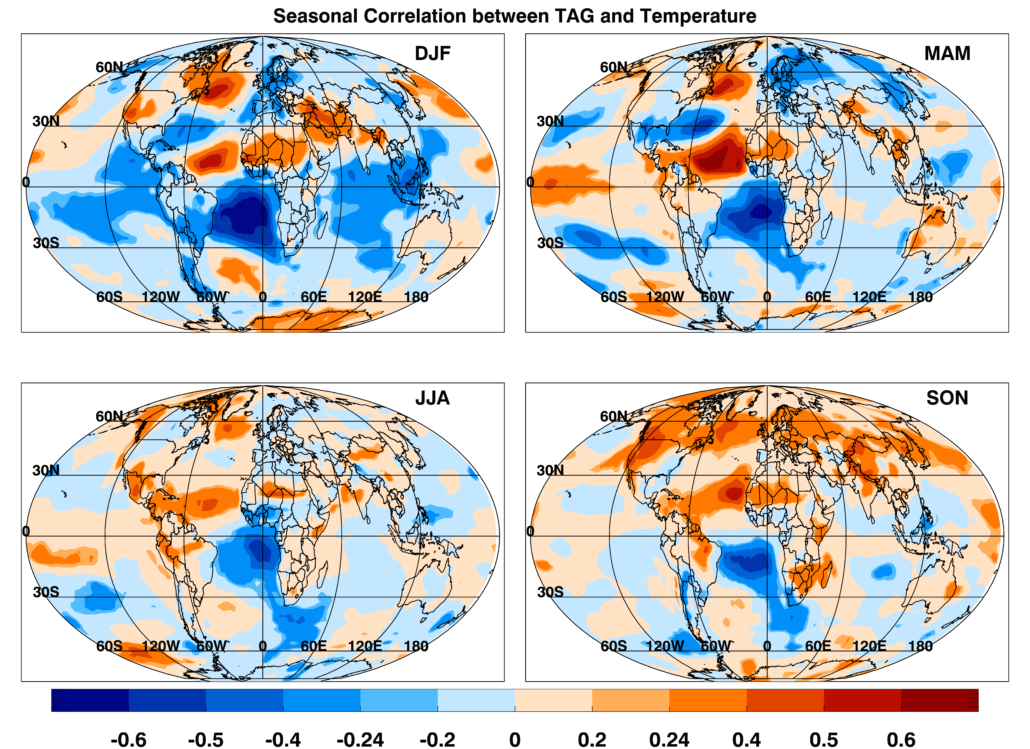
Dec-Jan-Feb (DJF), Mar-Apr-May (MAM), Jun-Jul-Aug (JJA), and Sep-Oct-Nov (SON).
Temperature and WPWP Correlations
Annual and seasonal correlation maps between the detrended West Pacific Warm Pool (WPWP) index and global temperature from 1951-2018 are shown. WPWP index was detrended before calculating correlation coefficients because it has a pronounced linear trend. Any correlation above/below +/- 0.24 is significant at the 95% significance threshold using a t-test score.
Positive correlation (red) result from either positive WPWP and above average temperature, or negative WPWP and below average temperature. Negative correlation (blue) result from either positive WPWP and below average temperature, or negative WPWP and above average temperature.
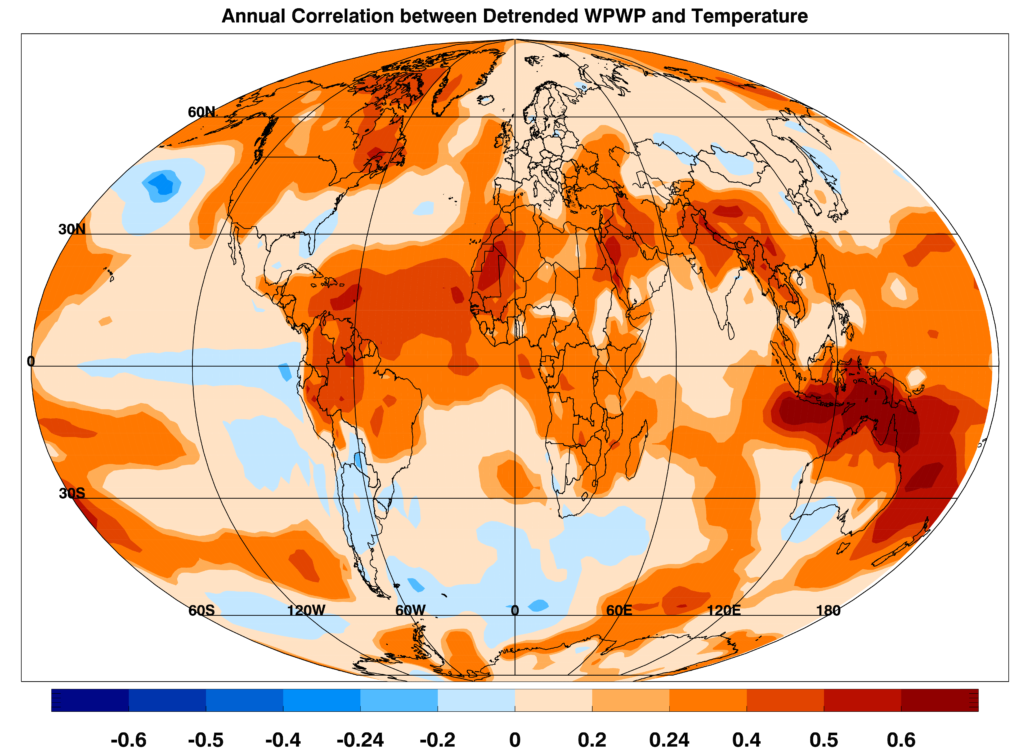
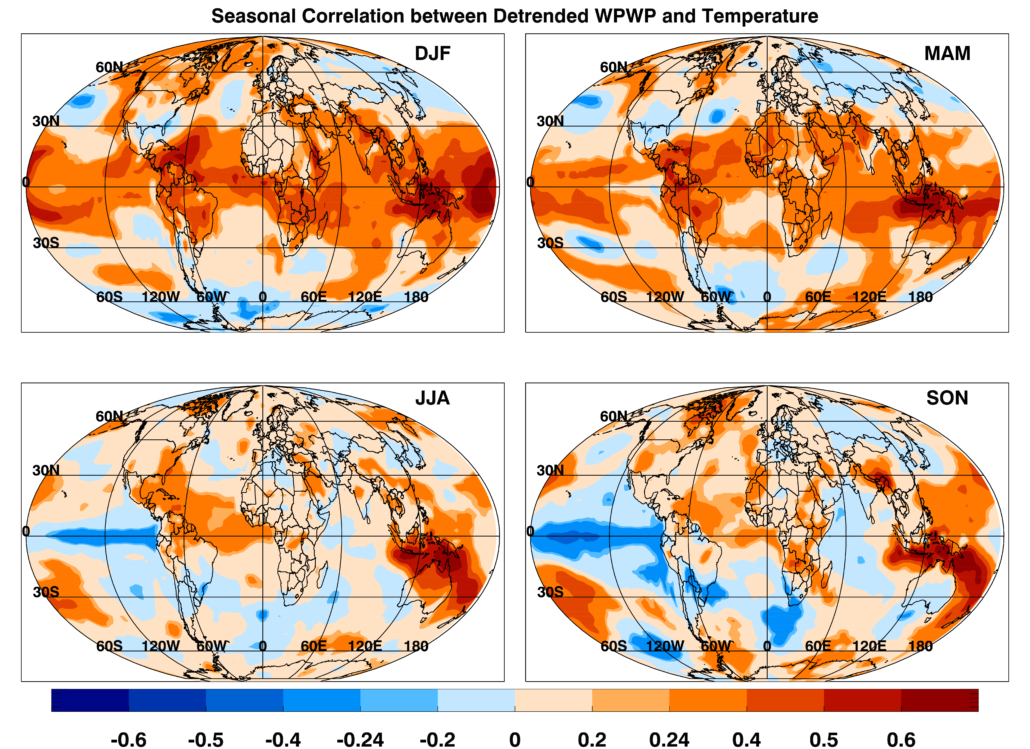
Dec-Jan-Feb (DJF), Mar-Apr-May (MAM), Jun-Jul-Aug (JJA), and Sep-Oct-Nov (SON).
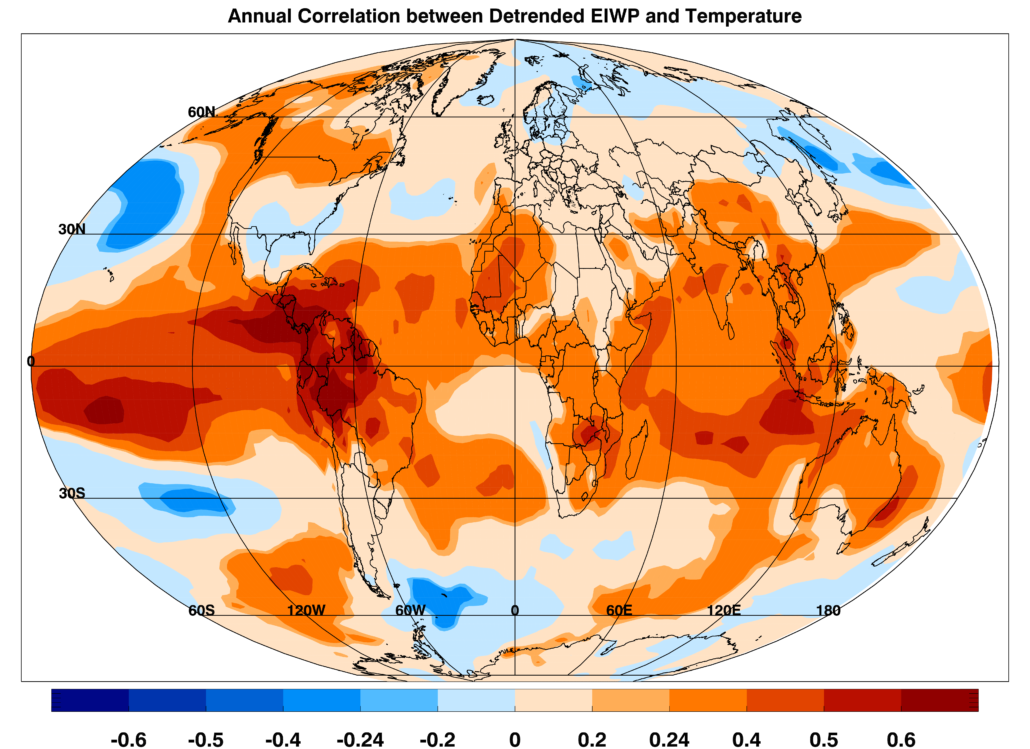
Temperature and EIWP Correlations
Annual and seasonal correlation maps between the detrended East Indian Warm Pool (EIWP) index and global temperature from 1951-2018 are shown. EIWP index was detrended before calculating correlation coefficients because it has a pronounced linear trend. Any correlation above/below +/- 0.24 is significant at the 95% significance threshold using a t-test score.
Positive correlation (red) result from either positive EIWP and above average temperature, or negative EIWP and below average temperature. Negative correlation (blue) result from either positive EIWP and below average temperature, or negative EIWP and above average temperature.
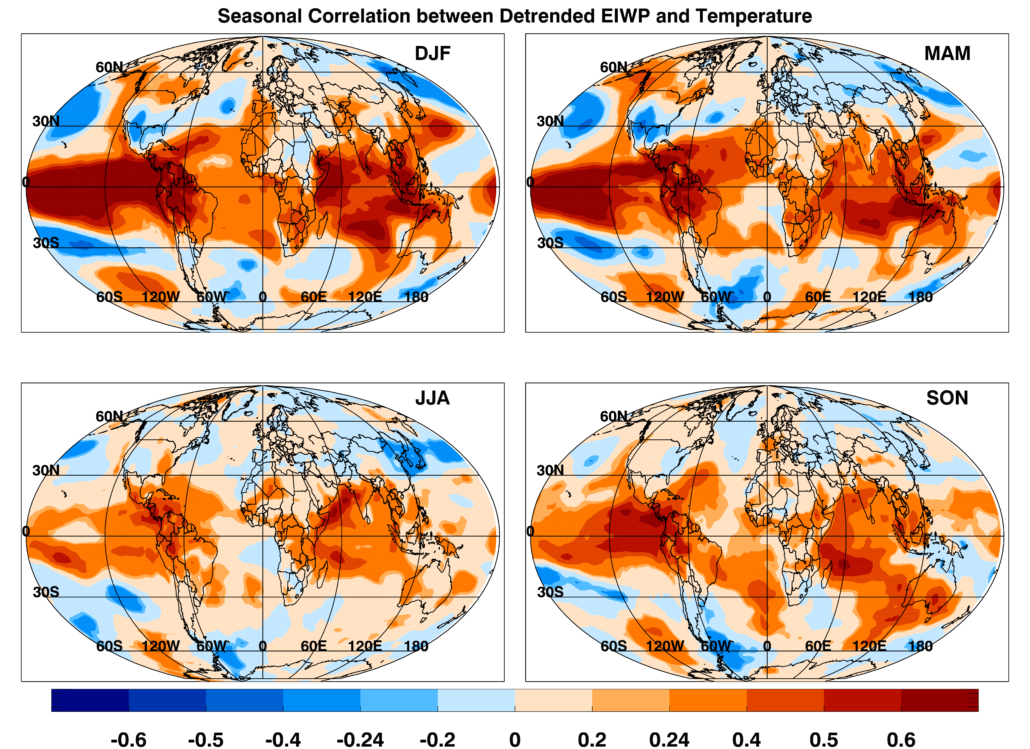
Dec-Jan-Feb (DJF), Mar-Apr-May (MAM), Jun-Jul-Aug (JJA), and Sep-Oct-Nov (SON).
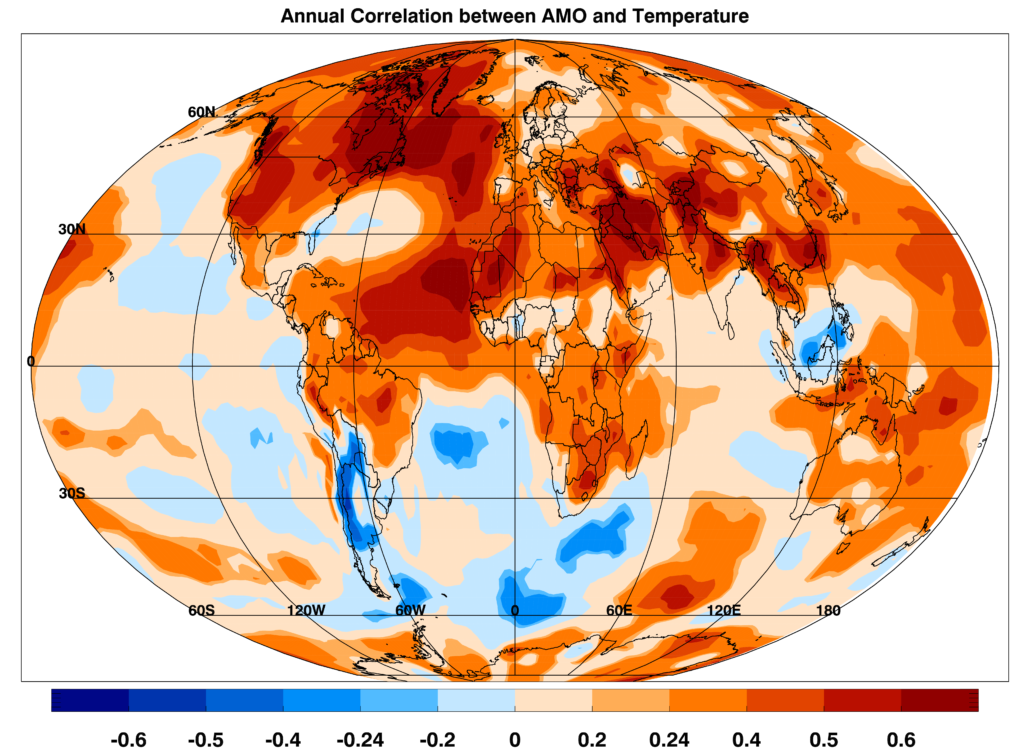
Temperature and AMO Correlations
Annual and seasonal correlation maps between the Atlantic Multidecadal Oscillation (AMO) and global temperature from 1951-2018 are shown. Any correlation above/below +/- 0.24 is significant at the 95% significance threshold using a t-test score.
Positive correlation (red) result from either positive AMO and above average temperature, or negative AMO and below average temperature. Negative correlation (blue) result from either positive AMO and below average temperature, or negative AMO and above average temperature.
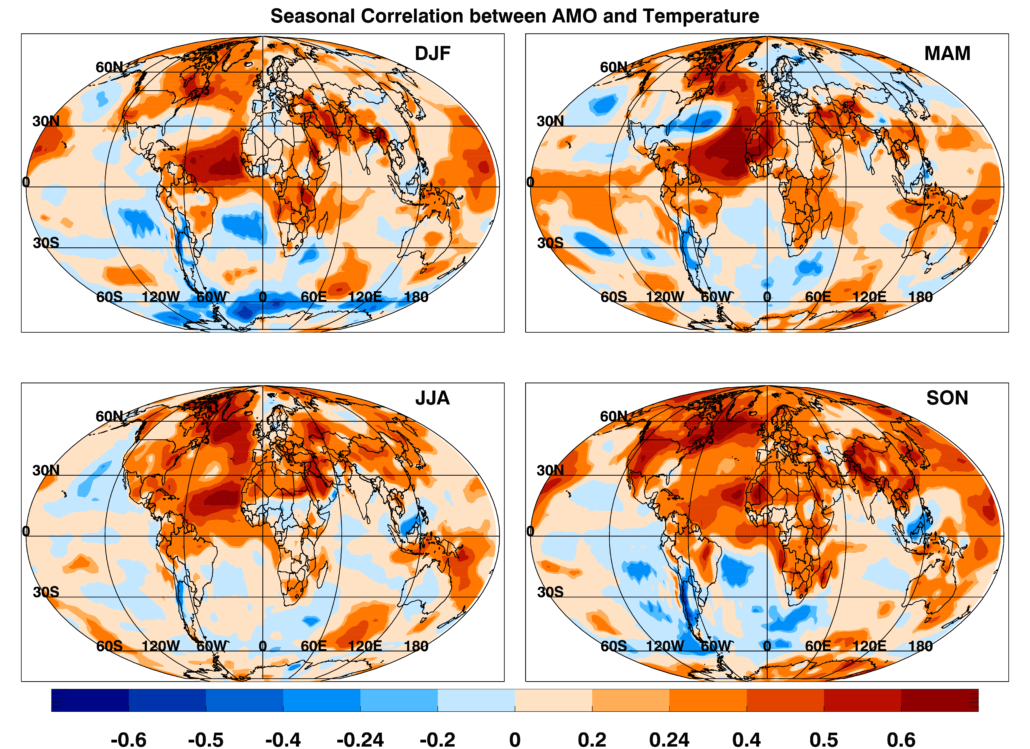
Dec-Jan-Feb (DJF), Mar-Apr-May (MAM), Jun-Jul-Aug (JJA), and Sep-Oct-Nov (SON).
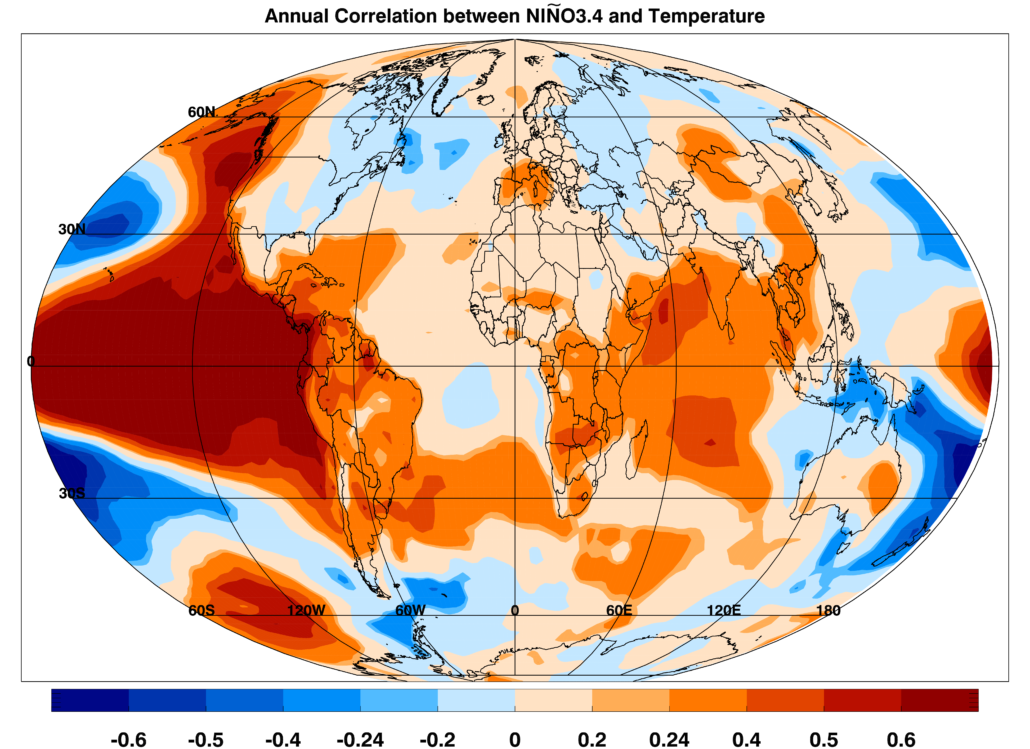
Temperature and Niño3.4 Correlations
Annual and seasonal correlation maps between the Niño3.4 index and global temperature from 1951-2018 are shown. Any correlation above/below +/- 0.24 is significant at the 95% significance threshold using a t-test score.
Positive correlation (red) result from either positive Niño3.4 and above average temperature, or negative Niño3.4 and below average temperature. Negative correlation (blue) result from either positive Niño3.4 and below average temperature, or negative Niño3.4 and above average temperature.
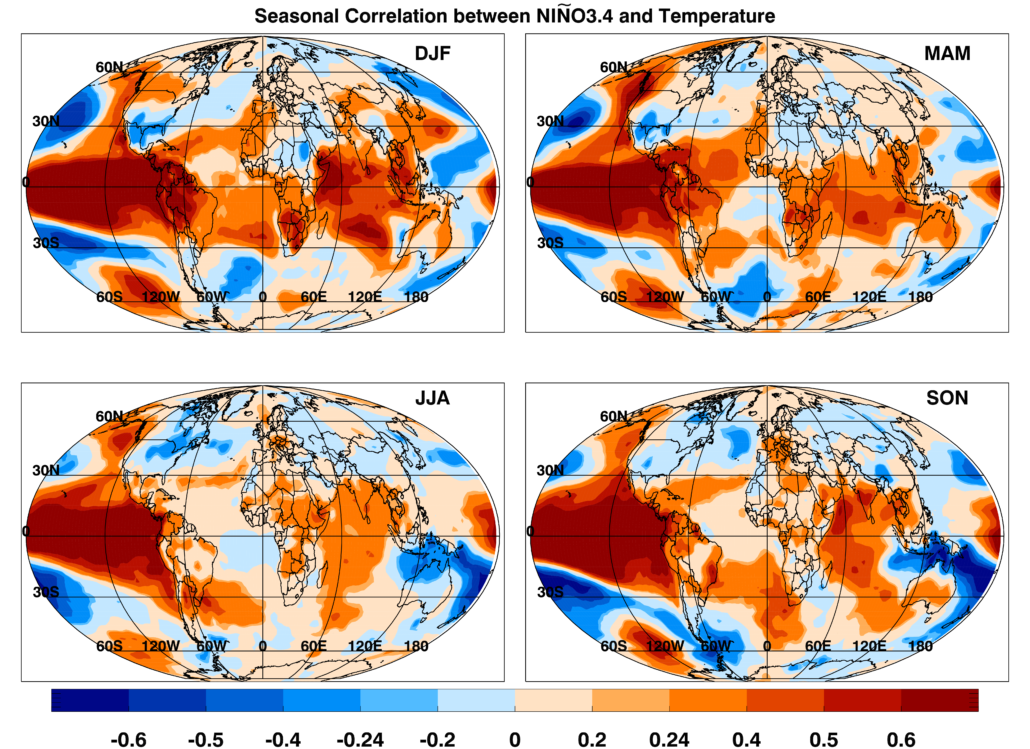
Dec-Jan-Feb (DJF), Mar-Apr-May (MAM), Jun-Jul-Aug (JJA), and Sep-Oct-Nov (SON).
Major conclusions of these analyses are:
- Positive and negative phases of DCV phenomena – the PDO, the TAG variability, the WPWP and EIWP variability, and El Niño-La Niña variability – are associated with substantial and significant, annual and seasonal, worldwide precipitation and temperature.